UltraPlot UltraPlot UltraPlot
  • Why UltraPlot?
  • Gallery
  • Installation guide
  • Usage
  • API
  • GitHub
  • Discussions
/

Getting Started

  • Installation
  • Why UltraPlot?
  • Using UltraPlot
  • UltraPlot Gallery
    • Shared axes and ABC labels
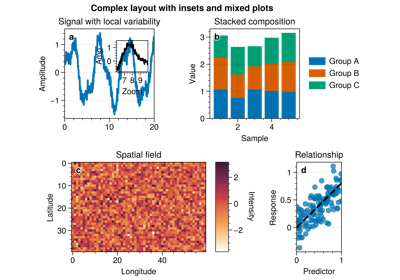
    • Complex layout with insets
    • Spanning labels with shared axes
    • Multi-panel colorbars
    • Legend with inset colorbar
    • Semantic legends
    • Robinson projection tracks
    • Orthographic comparison
    • Map projections and features
    • Simple choropleth
    • Curved quiver around a cylinder
    • Network graph styling
    • Lollipop comparisons
    • Calendar-aware datetime series
    • Box and violin plots
    • Ridge Plot
    • Radar chart
    • Layered Sankey diagram
    • Chord diagram
    • Ternary Plots
    • Phylogeny
    • Circos from BED
    • Top-aligned ribbon flow
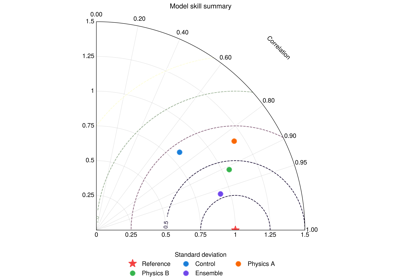
    • Taylor Diagram
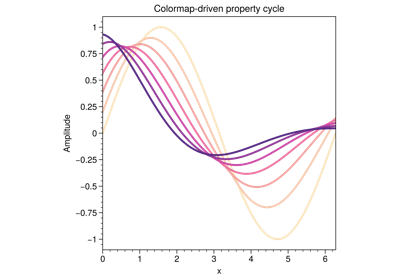
    • Colormap-driven cycles
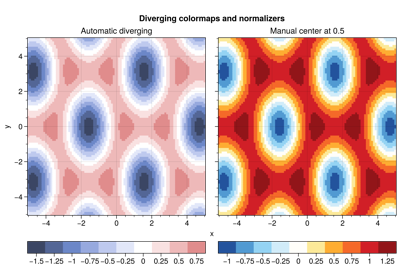
    • Diverging colormap

User Guide

  • The basics
  • Subplots
  • Cartesian axes
  • Networks
  • Geographic and polar axes
  • Colorbars and legends
  • Insets and panels
  • 1D plotting commands
  • 2D plotting commands
  • Statistical plotting
  • Colormaps
  • Color cycles
  • Color names
  • Font selection
  • Configuring UltraPlot

Reference

  • API reference
  • Lazy Loading and Adding New Modules
  • External links
  • What’s new?
  • How to contribute?
  • About UltraPlot

Table of Contents

Getting Started

  • Installation
  • Why UltraPlot?
  • Using UltraPlot
  • UltraPlot Gallery

User Guide

  • The basics
  • Subplots
  • Cartesian axes
  • Networks
  • Geographic and polar axes
  • Colorbars and legends
  • Insets and panels
  • 1D plotting commands
  • 2D plotting commands
  • Statistical plotting
  • Colormaps
  • Color cycles
  • Color names
  • Font selection
  • Configuring UltraPlot

Reference

  • API reference
  • Lazy Loading and Adding New Modules
  • External links
  • What’s new?
  • How to contribute?
  • About UltraPlot
/
  1. UltraPlot /
  2. UltraPlot Gallery
View Source Open in ChatGPT Open in Claude

UltraPlot Gallery#

Curated examples that highlight what UltraPlot does beyond base Matplotlib: complex layouts, advanced legends and colorbars, GeoAxes, and specialized plot types. Each script renders a publication-style figure and becomes a gallery entry.

Shared axes and ABC labels

Shared axes and ABC labels

Complex layout with insets

Complex layout with insets

Spanning labels with shared axes

Spanning labels with shared axes

Multi-panel colorbars

Multi-panel colorbars

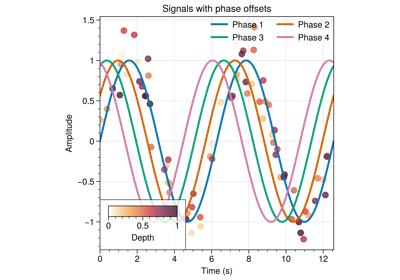
Legend with inset colorbar

Legend with inset colorbar

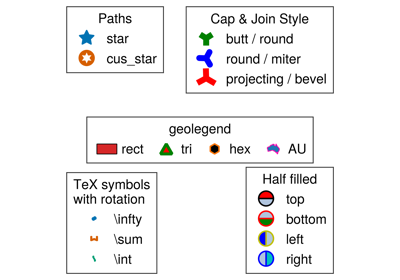
Semantic legends

Semantic legends

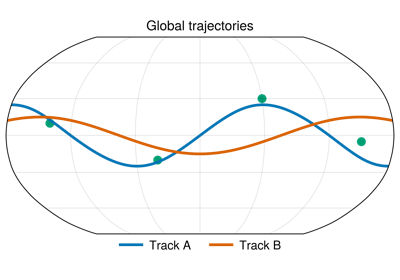
Robinson projection tracks

Robinson projection tracks

Orthographic comparison

Orthographic comparison

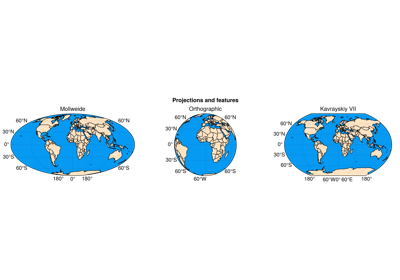
Map projections and features

Map projections and features

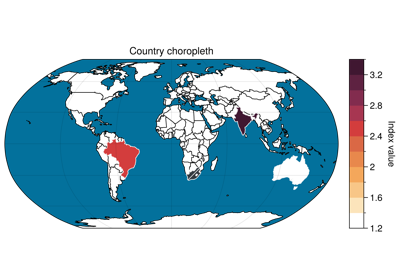
Simple choropleth

Simple choropleth

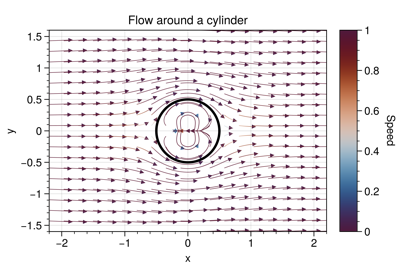
Curved quiver around a cylinder

Curved quiver around a cylinder

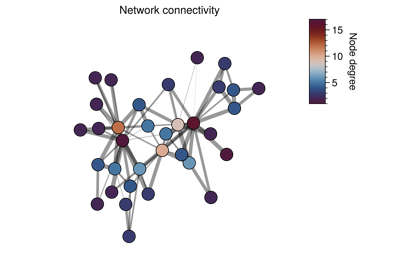
Network graph styling

Network graph styling

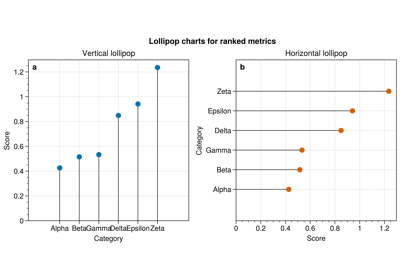
Lollipop comparisons

Lollipop comparisons

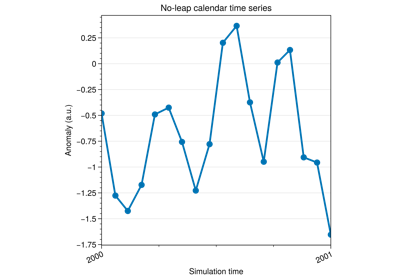
Calendar-aware datetime series

Calendar-aware datetime series

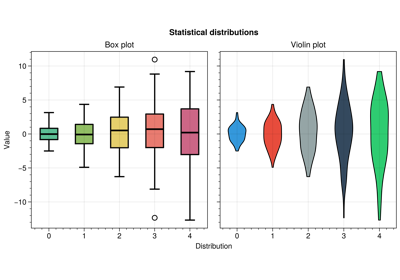
Box and violin plots

Box and violin plots

Ridge Plot

Ridge Plot

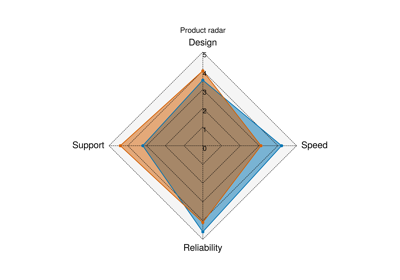
Radar chart

Radar chart

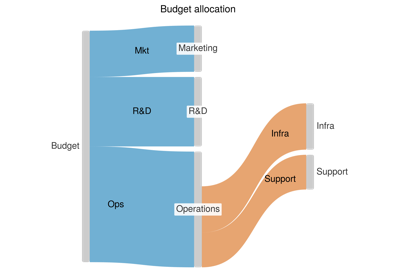
Layered Sankey diagram

Layered Sankey diagram

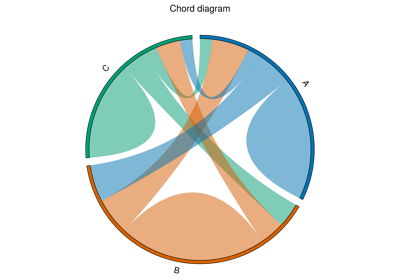
Chord diagram

Chord diagram

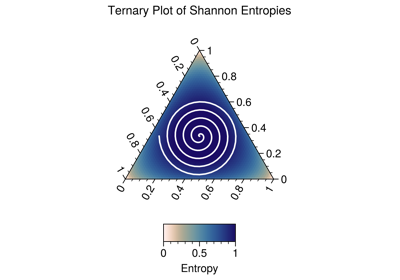
Ternary Plots

Ternary Plots

Phylogeny

Phylogeny

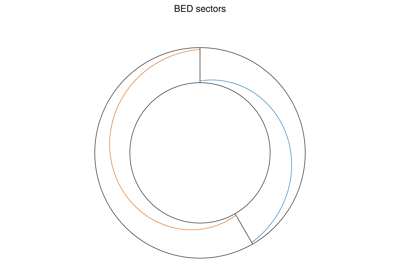
Circos from BED

Circos from BED

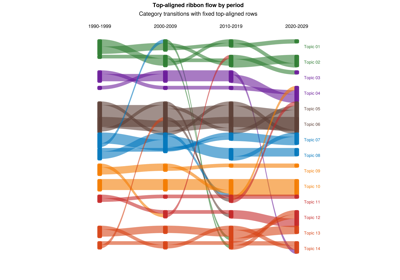
Top-aligned ribbon flow

Top-aligned ribbon flow

Taylor Diagram

Taylor Diagram

Colormap-driven cycles

Colormap-driven cycles

Diverging colormap

Diverging colormap

Download all examples in Python source code: gallery_python.zip

Download all examples in Jupyter notebooks: gallery_jupyter.zip

Gallery generated by Sphinx-Gallery

Previous
Using UltraPlot
Next
Shared axes and ABC labels

2026, UltraPlot

Made with Sphinx and Shibuya theme.