
Note
Go to the end to download the full example code.
Semantic legends#
Build legends from semantic mappings rather than existing artists.
Why UltraPlot here?#
UltraPlot adds semantic legend helpers on both axes and figures:
entrylegend, catlegend, sizelegend, numlegend, and geolegend.
These are useful when you want legend meaning decoupled from plotted handles, or
when you want a standalone semantic key that describes an encoding directly.
Key functions: ultraplot.axes.Axes.entrylegend(), ultraplot.axes.Axes.catlegend(), ultraplot.axes.Axes.sizelegend(), ultraplot.axes.Axes.numlegend(), ultraplot.axes.Axes.geolegend(), ultraplot.figure.Figure.entrylegend(), ultraplot.figure.Figure.catlegend(), ultraplot.figure.Figure.sizelegend(), ultraplot.figure.Figure.numlegend(), ultraplot.figure.Figure.geolegend().
See also#
Semantic Legend with custom markers and advanced styles
import matplotlib.transforms as mtransforms
import numpy as np
from matplotlib.markers import CapStyle, JoinStyle, MarkerStyle
from matplotlib.path import Path

import ultraplot as uplt

star = Path.unit_regular_star(6)
circle = Path.unit_circle()
star_path = Path.unit_regular_star(5)
cut_star = Path(
    vertices=np.concatenate([circle.vertices, star.vertices[::-1, ...]]),
    codes=np.concatenate([circle.codes, star.codes]),
)

fig, ax = uplt.subplots()

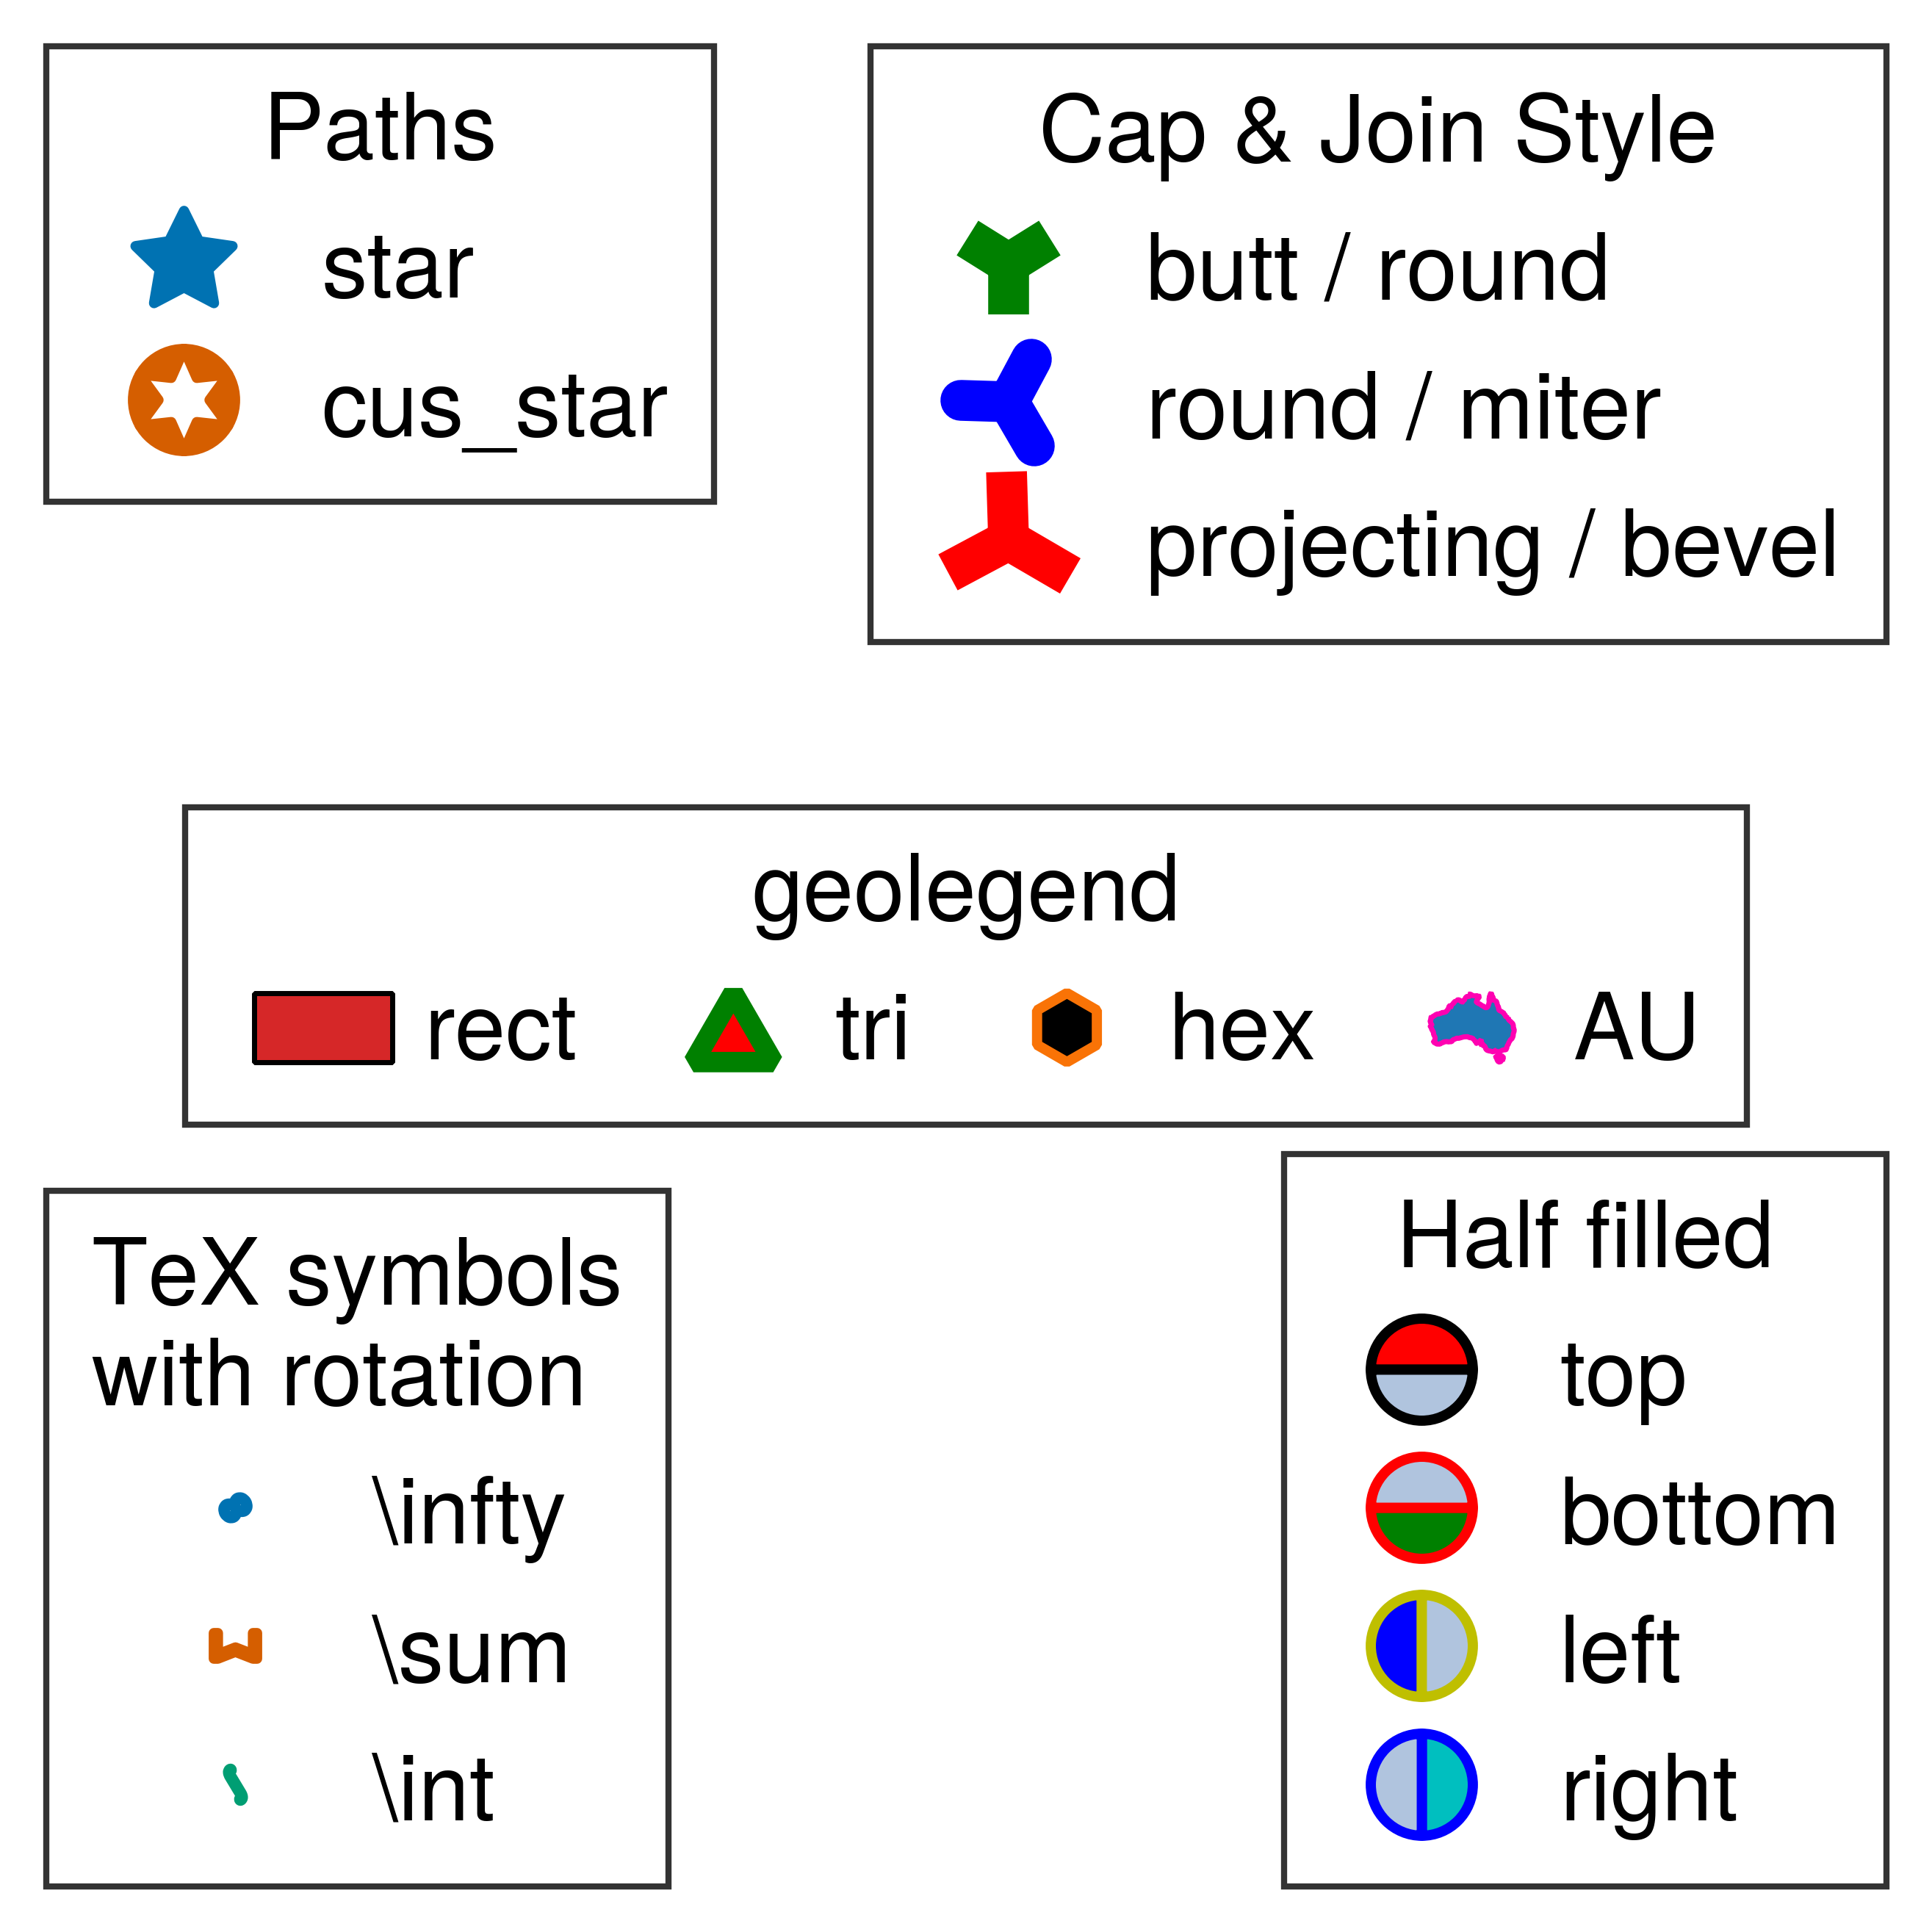
# upper left legend with custom mark
ax.catlegend(
    ["star", "cus_star"],
    marker=[star_path, cut_star],
    markersize=10,
    add=True,
    loc="ul",
    title="Paths",
    ncols=1,
)

# upper right legend with advanced CapStyle and JoinStyle
ax.catlegend(
    ["butt / round", "round / miter", "projecting / bevel"],
    marker="1",
    markersize=10,
    markeredgecolor=list("gbr"),
    markeredgewidth=4,
    markerfacecoloralt="none",
    marker_capstyle=[
        CapStyle.butt,
        CapStyle.round,
        CapStyle.projecting,
    ],
    marker_joinstyle=[
        JoinStyle.round,
        JoinStyle.miter,
        JoinStyle.bevel,
    ],
    marker_transform=[mtransforms.Affine2D().rotate_deg(x) for x in [0, 30, 60]],
    title="Cap & Join Style",
    add=True,
    loc="ur",
    ncols=1,
)

# center geolegend with different styles
ax.geolegend(
    ["rect", "tri", "hex", "AU"],
    facecolor=["tab:red", "r", "k", "tab:blue"],
    ec=["k", "g", "orange", "bright pink"],
    loc="c",
    title="geolegend",
    ew=[0.5, 2, 1, 0.5],
    markersize=10,
    ncols=4,
    handletextpad=0.1,
    columnspacing=0.7,
)

# lower left legend with TeX symbols and rotation transform
ax.catlegend(
    ["\\infty", "\\sum", "\\int"],
    marker=[r"$\infty$", r"$\sum$", r"$\int$"],
    s=[6, 18, 9],  # ms/markersize=[6,8,10]
    title="TeX symbols\nwith rotation",
    marker_transform=[mtransforms.Affine2D().rotate_deg(x) for x in [30, 90, 45]],
    add=True,
    loc="ll",
    ncols=1,
)

# lower right legend with different fill style
ax.catlegend(
    ["top", "bottom", "left", "right"],
    marker="o",
    markersize=10,
    mfc=["r", "g", "b", "c"],
    markerfacecoloralt="lightsteelblue",
    markeredgecolor=["k", "r", "y", "b"],
    fillstyle=["top", "bottom", "left", "right"],
    title="Half filled",
    add=True,
    loc="lr",
    ncols=1,
)
ax.axis("off")
fig.show()
import cartopy.crs as ccrs
import shapely.geometry as sg

import ultraplot as uplt

fig, ax = uplt.subplots(refwidth=5.0)
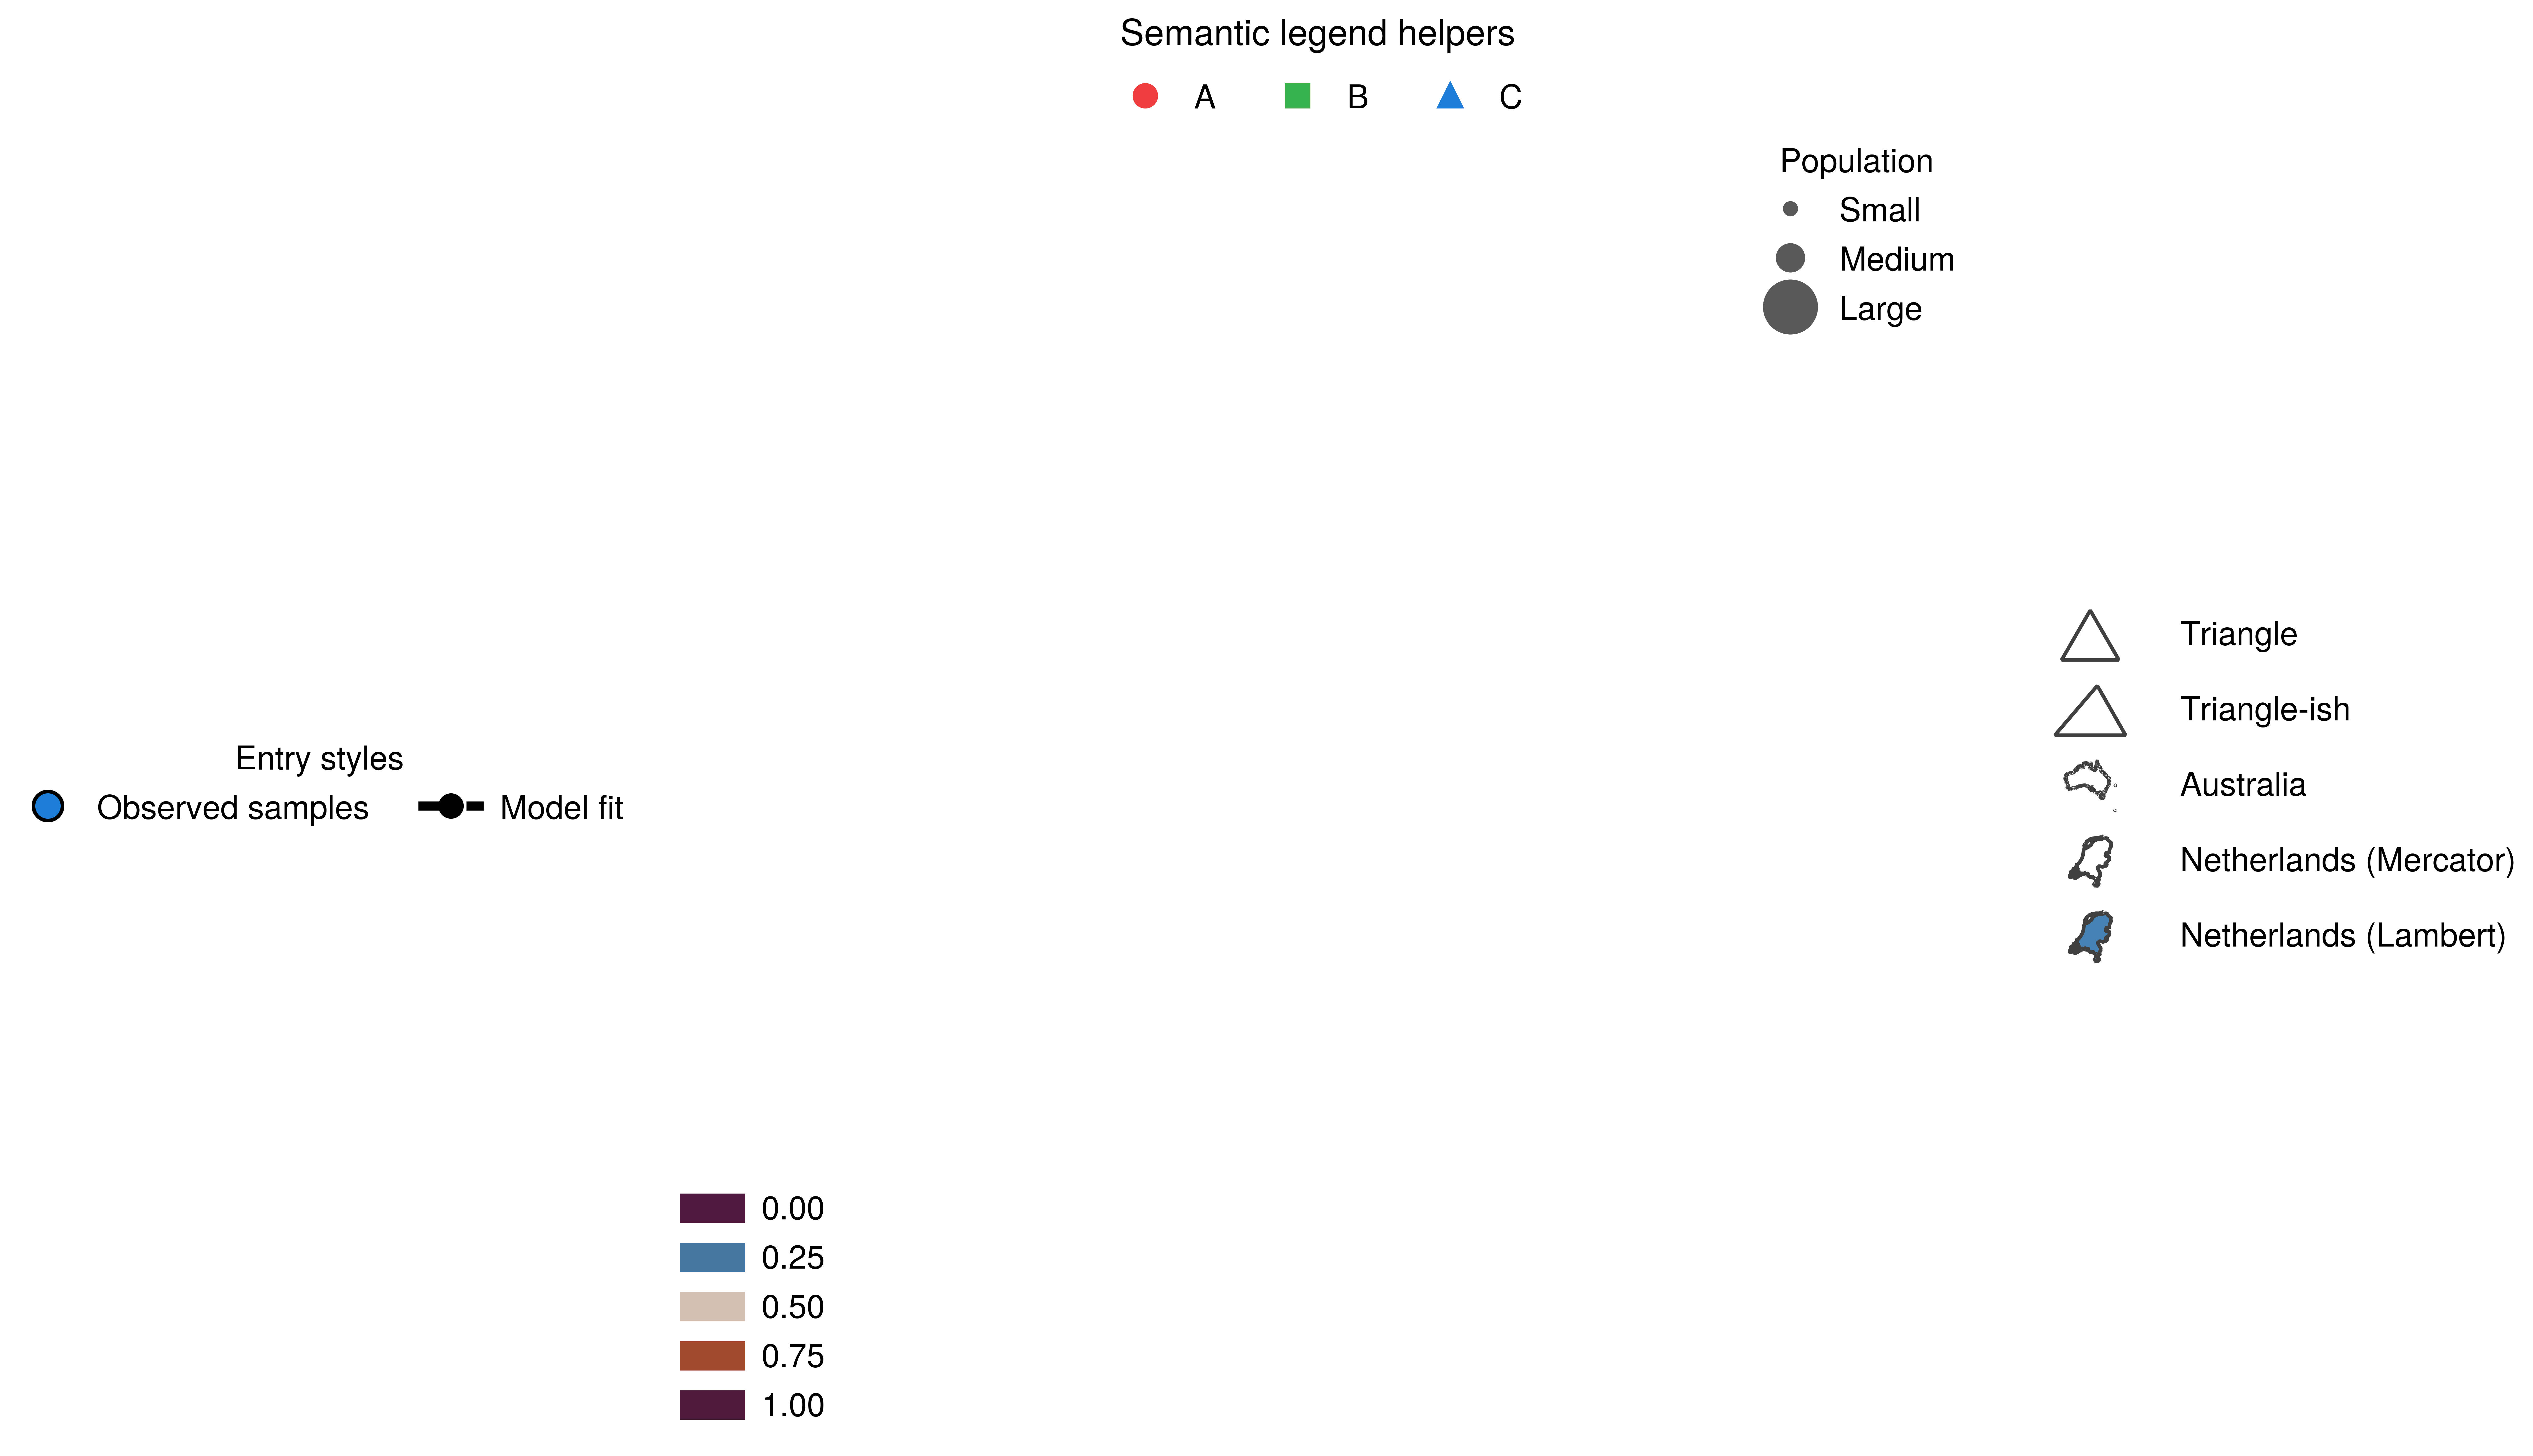
ax.format(title="Semantic legend helpers")

ax.entrylegend(
    [
        {
            "label": "Observed samples",
            "line": False,
            "marker": "o",
            "markersize": 8,
            "markerfacecolor": "blue7",
            "markeredgecolor": "black",
        },
        {
            "label": "Model fit",
            "line": True,
            "color": "black",
            "linewidth": 2.5,
            "linestyle": "--",
        },
    ],
    loc="l",
    title="Entry styles",
    frameon=False,
)
ax.catlegend(
    ["A", "B", "C"],
    colors={"A": "red7", "B": "green7", "C": "blue7"},
    markers={"A": "o", "B": "s", "C": "^"},
    loc="top",
    frameon=False,
)
ax.sizelegend(
    [10, 50, 200],
    labels=["Small", "Medium", "Large"],
    loc="upper right",
    title="Population",
    ncols=1,
    frameon=False,
)
ax.numlegend(
    vmin=0,
    vmax=1,
    n=5,
    cmap="viko",
    fmt="{:.2f}",
    loc="ll",
    ncols=1,
    frameon=False,
)

poly1 = sg.Polygon([(0, 0), (2, 0), (1.2, 1.4)])
ax.geolegend(
    [
        ("Triangle", "triangle"),
        ("Triangle-ish", poly1),
        ("Australia", "country:AU"),
        ("Netherlands (Mercator)", "country:NLD", "mercator"),
        (
            "Netherlands (Lambert)",
            "country:NLD",
            {
                "country_proj": ccrs.LambertConformal(
                    central_longitude=5,
                    central_latitude=52,
                ),
                "country_reso": "10m",
                "country_territories": False,
                "facecolor": "steelblue",
                "fill": True,
            },
        ),
    ],
    loc="r",
    ncols=1,
    handlesize=2.4,
    handletextpad=0.35,
    frameon=False,
    country_reso="10m",
)
ax.axis("off")
fig.show()
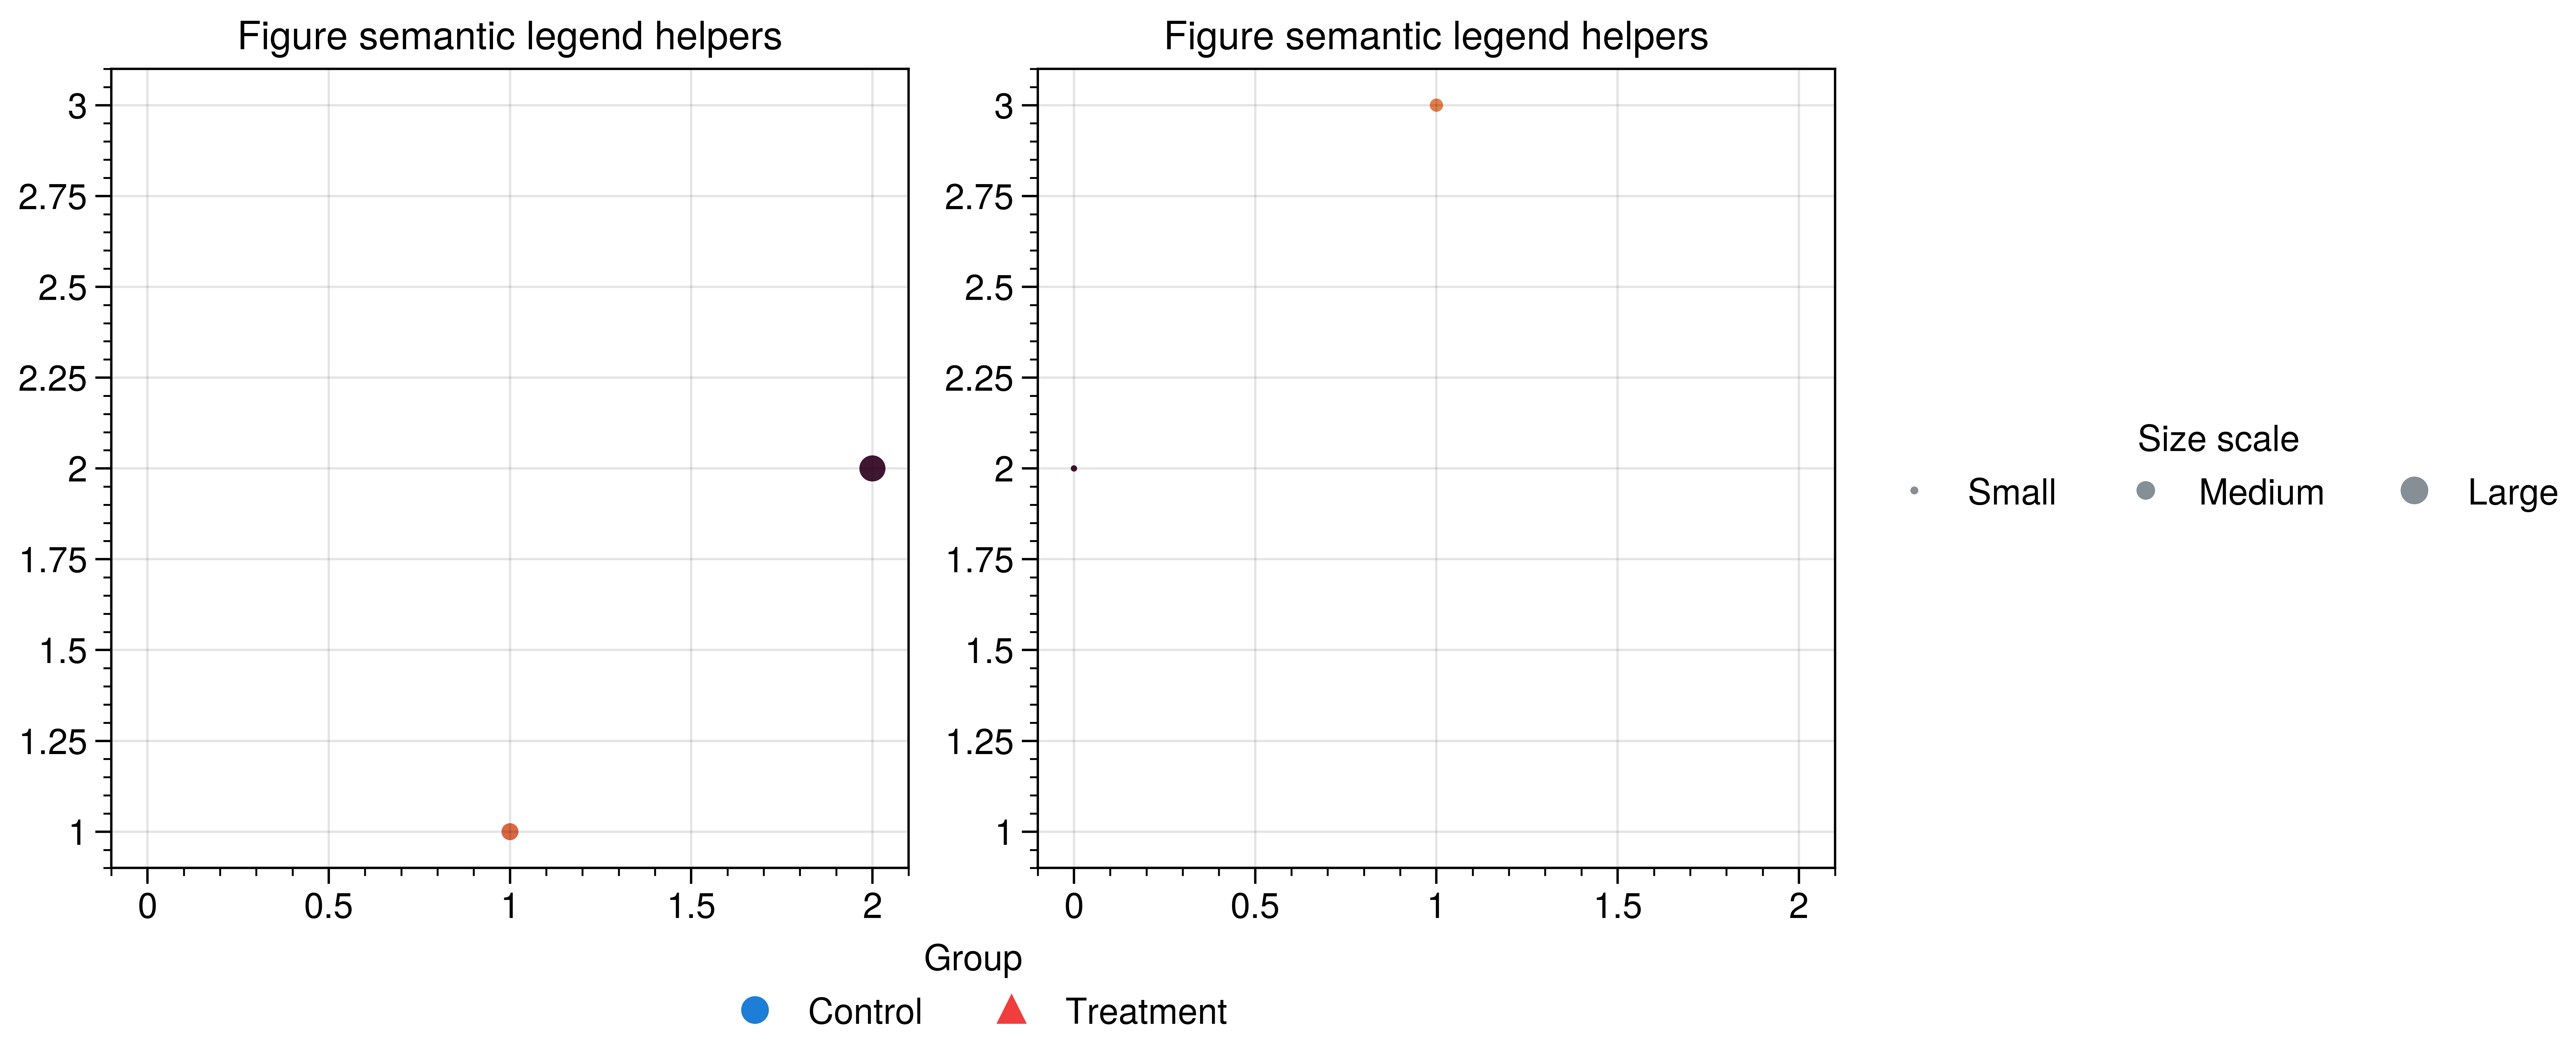
fig, axs = uplt.subplots(ncols=2, refwidth=2.8, share=False)
axs[0].scatter([0, 1, 2], [3, 1, 2], c=[0.2, 0.5, 0.8], s=[40, 120, 260])
axs[1].scatter([0, 1, 2], [2, 3, 1], c=[0.8, 0.4, 0.1], s=[60, 90, 220])
axs.format(title="Figure semantic legend helpers")

fig.catlegend(
    ["Control", "Treatment"],
    colors={"Control": "blue7", "Treatment": "red7"},
    markers={"Control": "o", "Treatment": "^"},
    ref=axs,
    loc="bottom",
    title="Group",
    frameon=False,
)
fig.sizelegend(
    [40, 120, 260],
    labels=["Small", "Medium", "Large"],
    color="gray6",
    ref=axs,
    loc="right",
    title="Size scale",
    frameon=False,
)
fig.show()
Total running time of the script: (0 minutes 3.603 seconds)