
Note
Go to the end to download the full example code.
Radar chart#
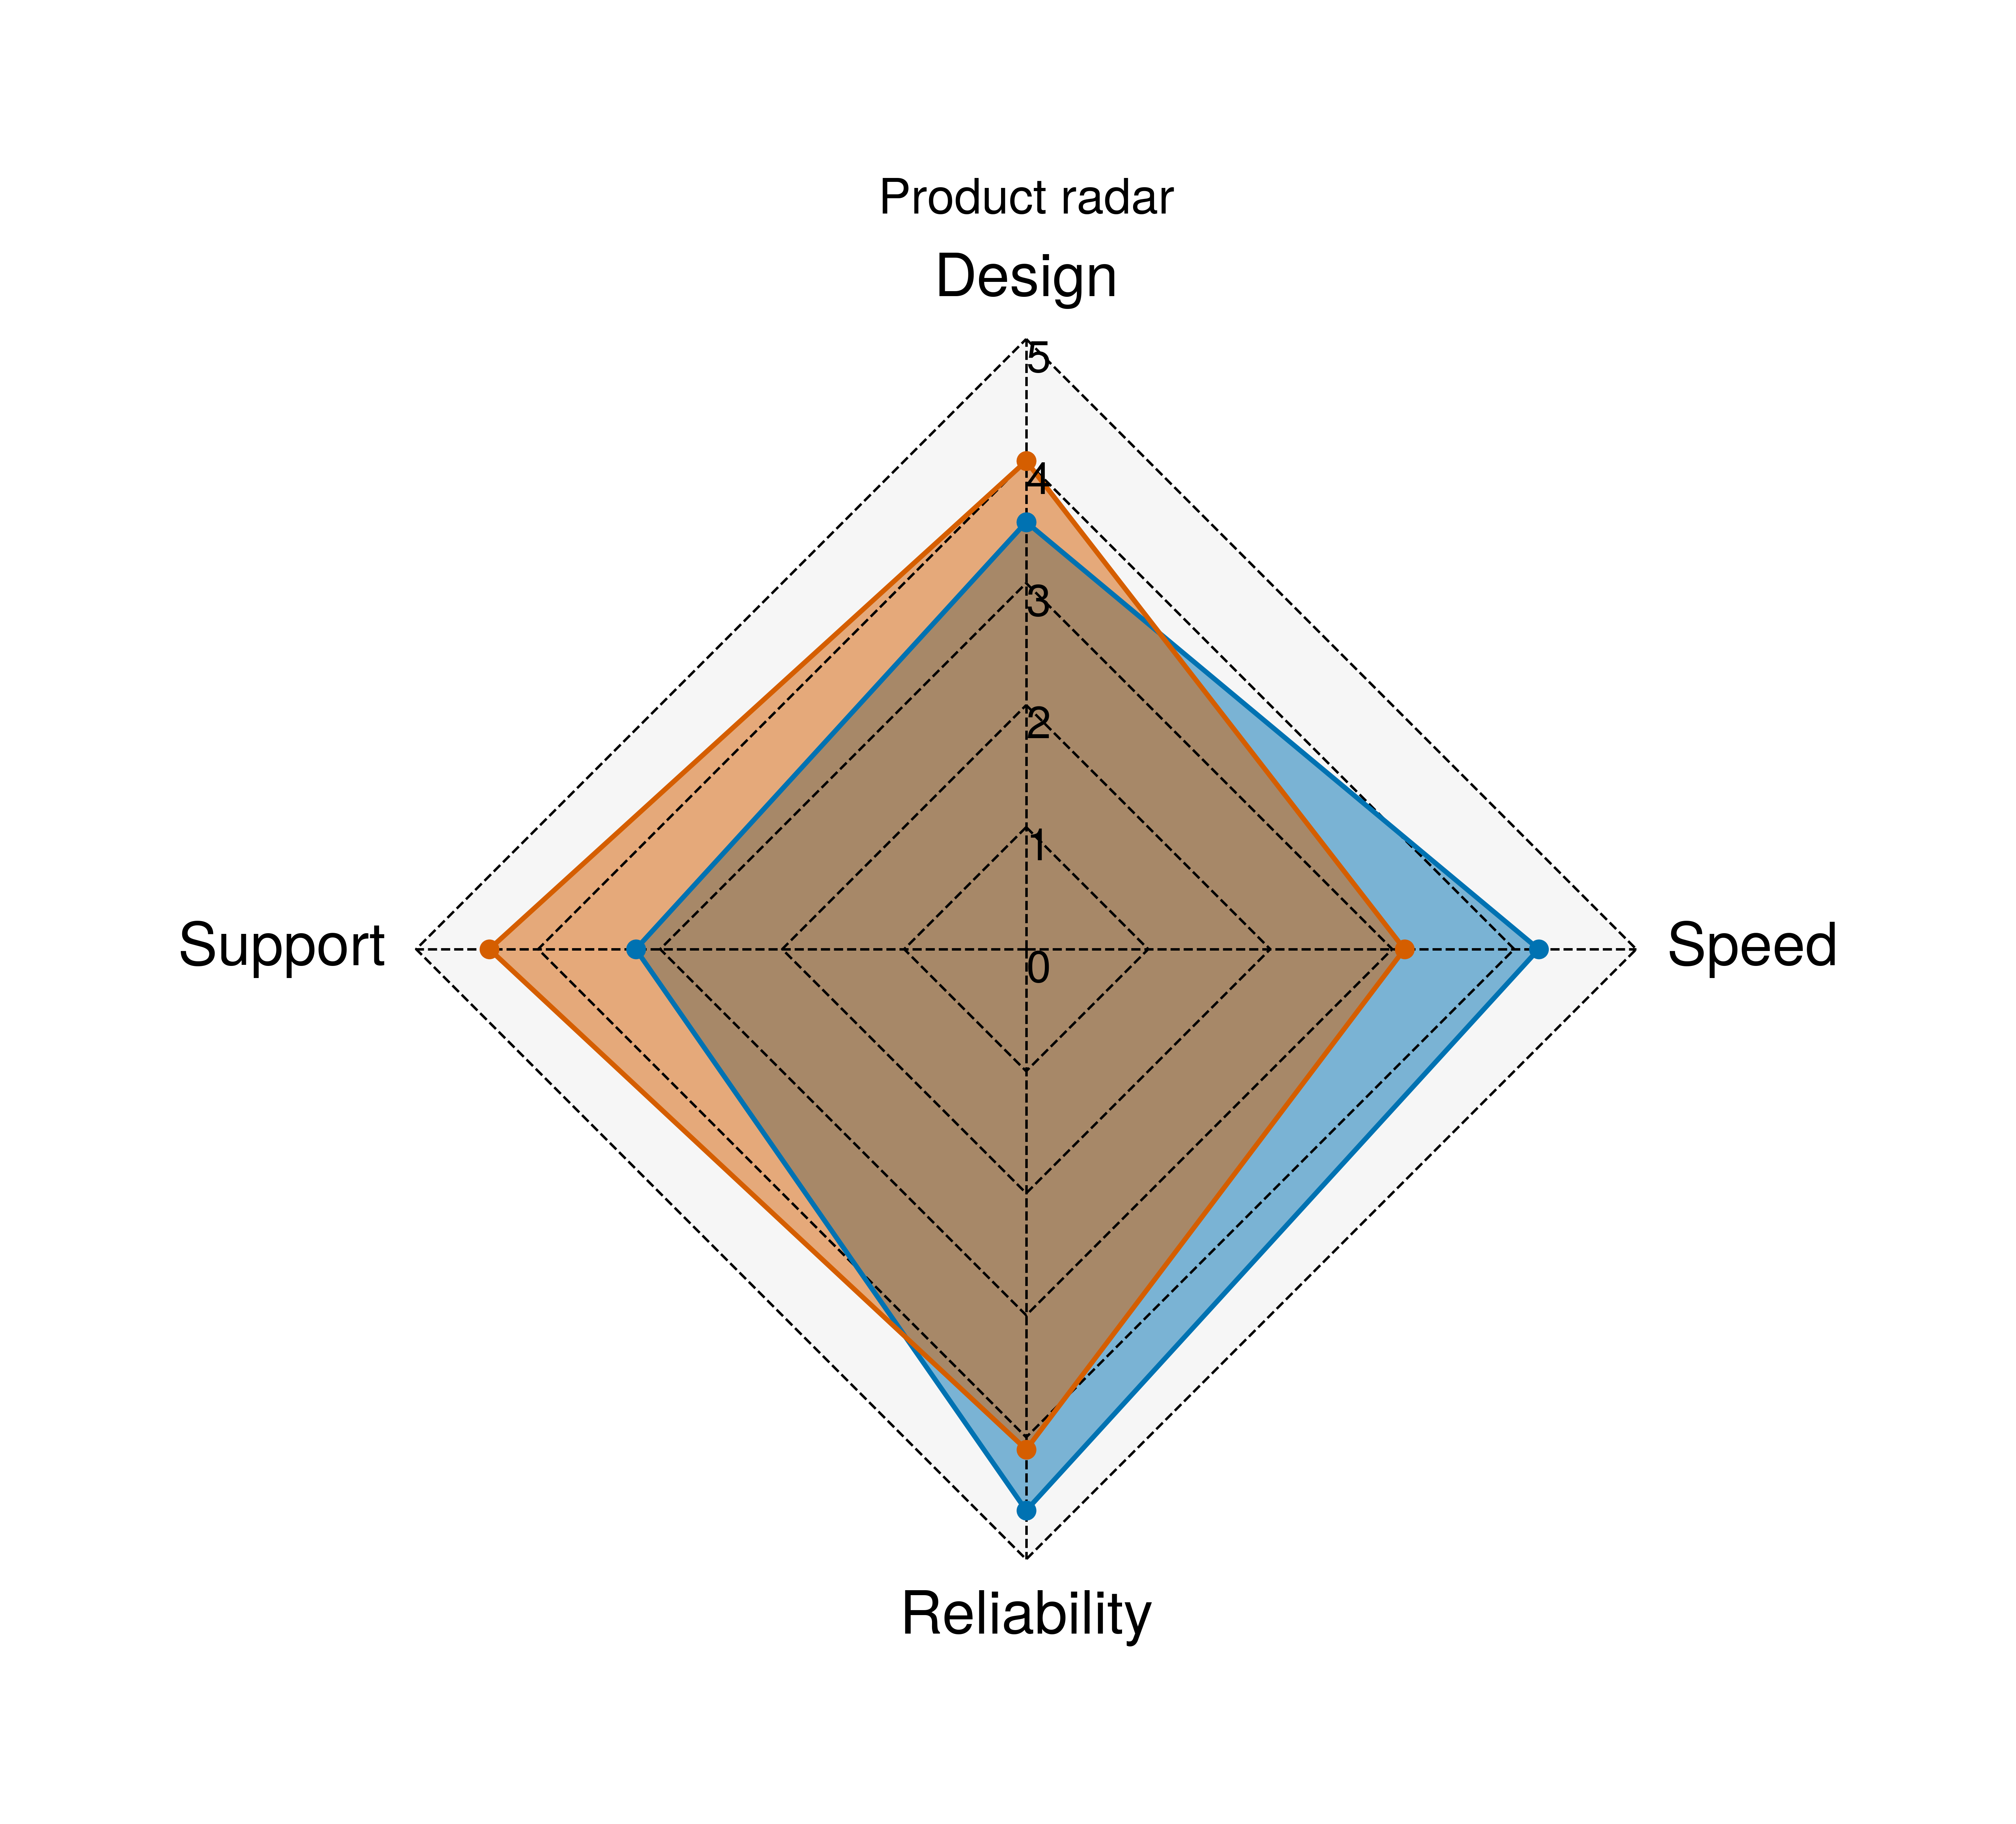
UltraPlot wrapper around pyCirclize’s radar chart helper.
import pandas as pd

import ultraplot as uplt

data = pd.DataFrame(
    {
        "Design": [3.5, 4.0],
        "Speed": [4.2, 3.1],
        "Reliability": [4.6, 4.1],
        "Support": [3.2, 4.4],
    },
    index=["Model A", "Model B"],
)

fig, ax = uplt.subplots(proj="polar", refwidth=3.6)
ax.radar_chart(
    data,
    vmin=0,
    vmax=5,
    fill=True,
    marker_size=4,
    grid_interval_ratio=0.2,
)
ax.format(title="Product radar")
fig.show()
Total running time of the script: (0 minutes 1.147 seconds)