
Note
Go to the end to download the full example code.
Box and violin plots#
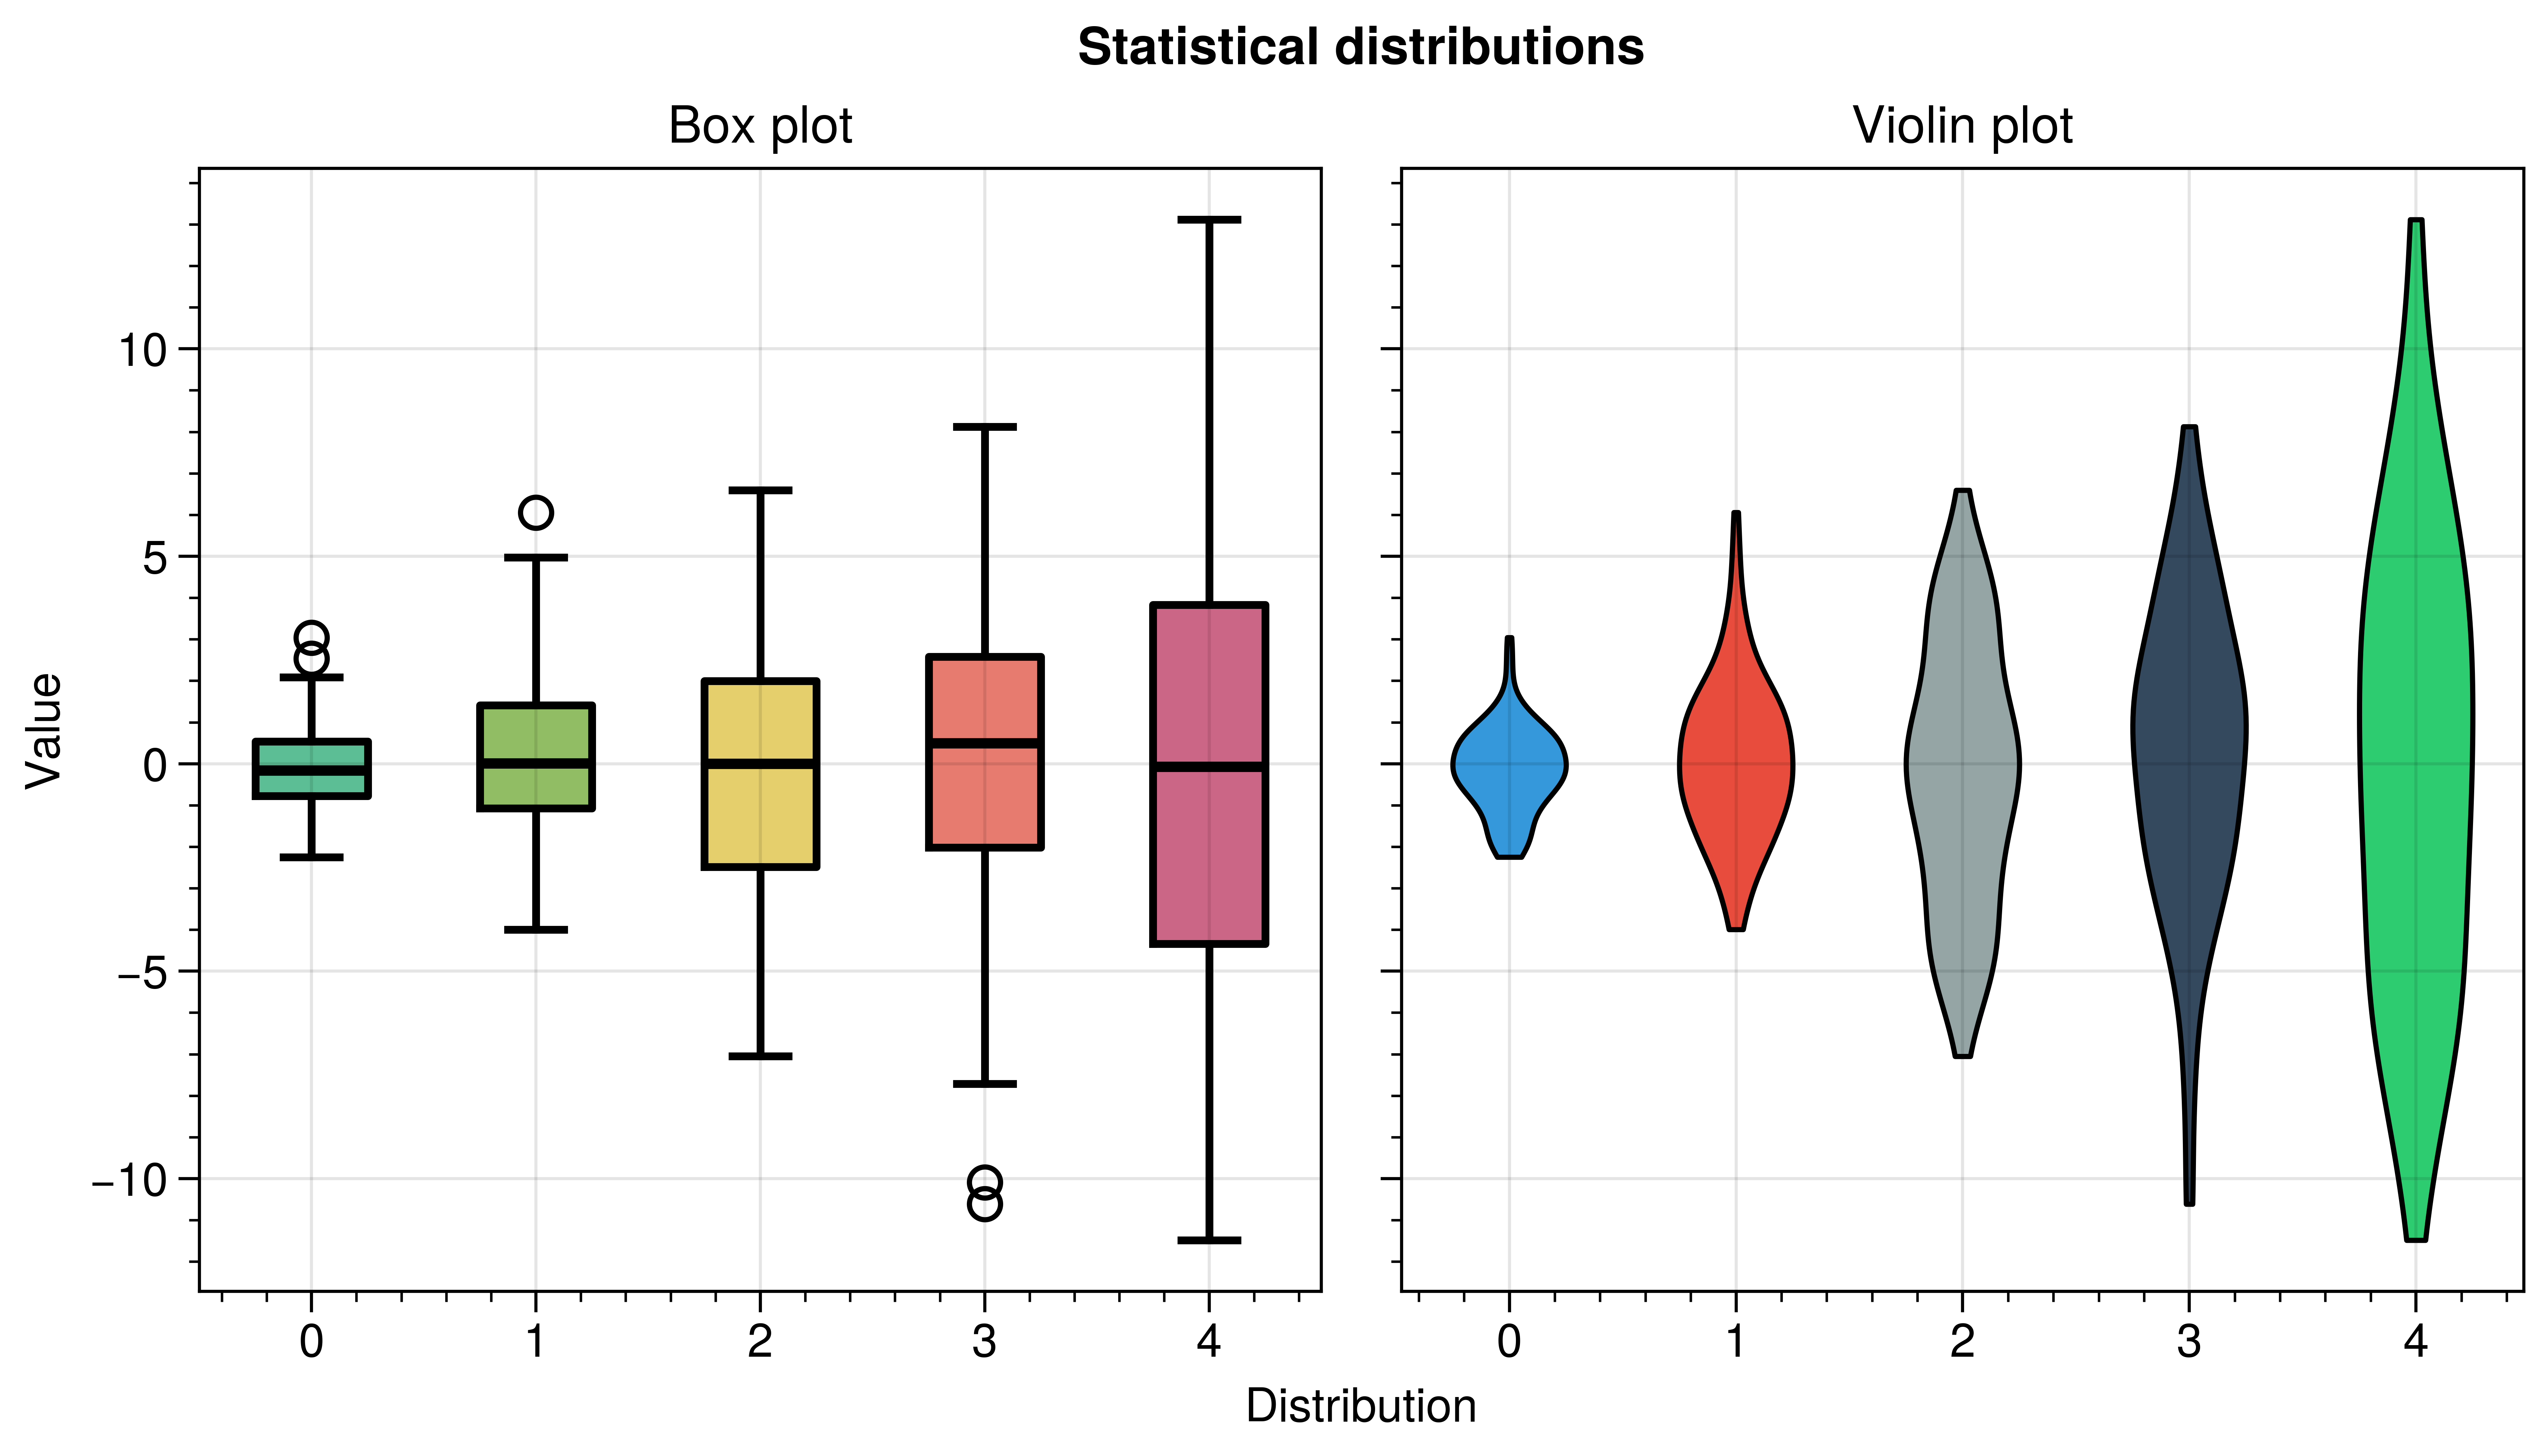
Standard box and violin plots with automatic customization.
Why UltraPlot here?#
UltraPlot wraps matplotlib.axes.Axes.boxplot() and matplotlib.axes.Axes.violinplot()
with more convenient arguments (like fillcolor, alpha) and automatically applies
cycle colors to the boxes/violins.
Key functions: ultraplot.axes.PlotAxes.boxplot(), ultraplot.axes.PlotAxes.violinplot().
See also#
import numpy as np

import ultraplot as uplt

# Generate sample data
data = np.array([np.random.normal(0, std, 100) for std in range(1, 6)])

fig, axs = uplt.subplots(ncols=2, refwidth=3)

# Box plot
axs[0].boxplot(data.T, lw=1.5, cycle="qual1", medianlw=2)
axs[0].format(title="Box plot", xlabel="Distribution", ylabel="Value")

# Violin plot
axs[1].violinplot(data.T, lw=1, cycle="flatui")
axs[1].format(title="Violin plot", xlabel="Distribution", ylabel="Value")

axs.format(suptitle="Statistical distributions")
uplt.show(block=1)
fig.show()
Total running time of the script: (0 minutes 1.001 seconds)