
Note
Go to the end to download the full example code.
Layered Sankey diagram#
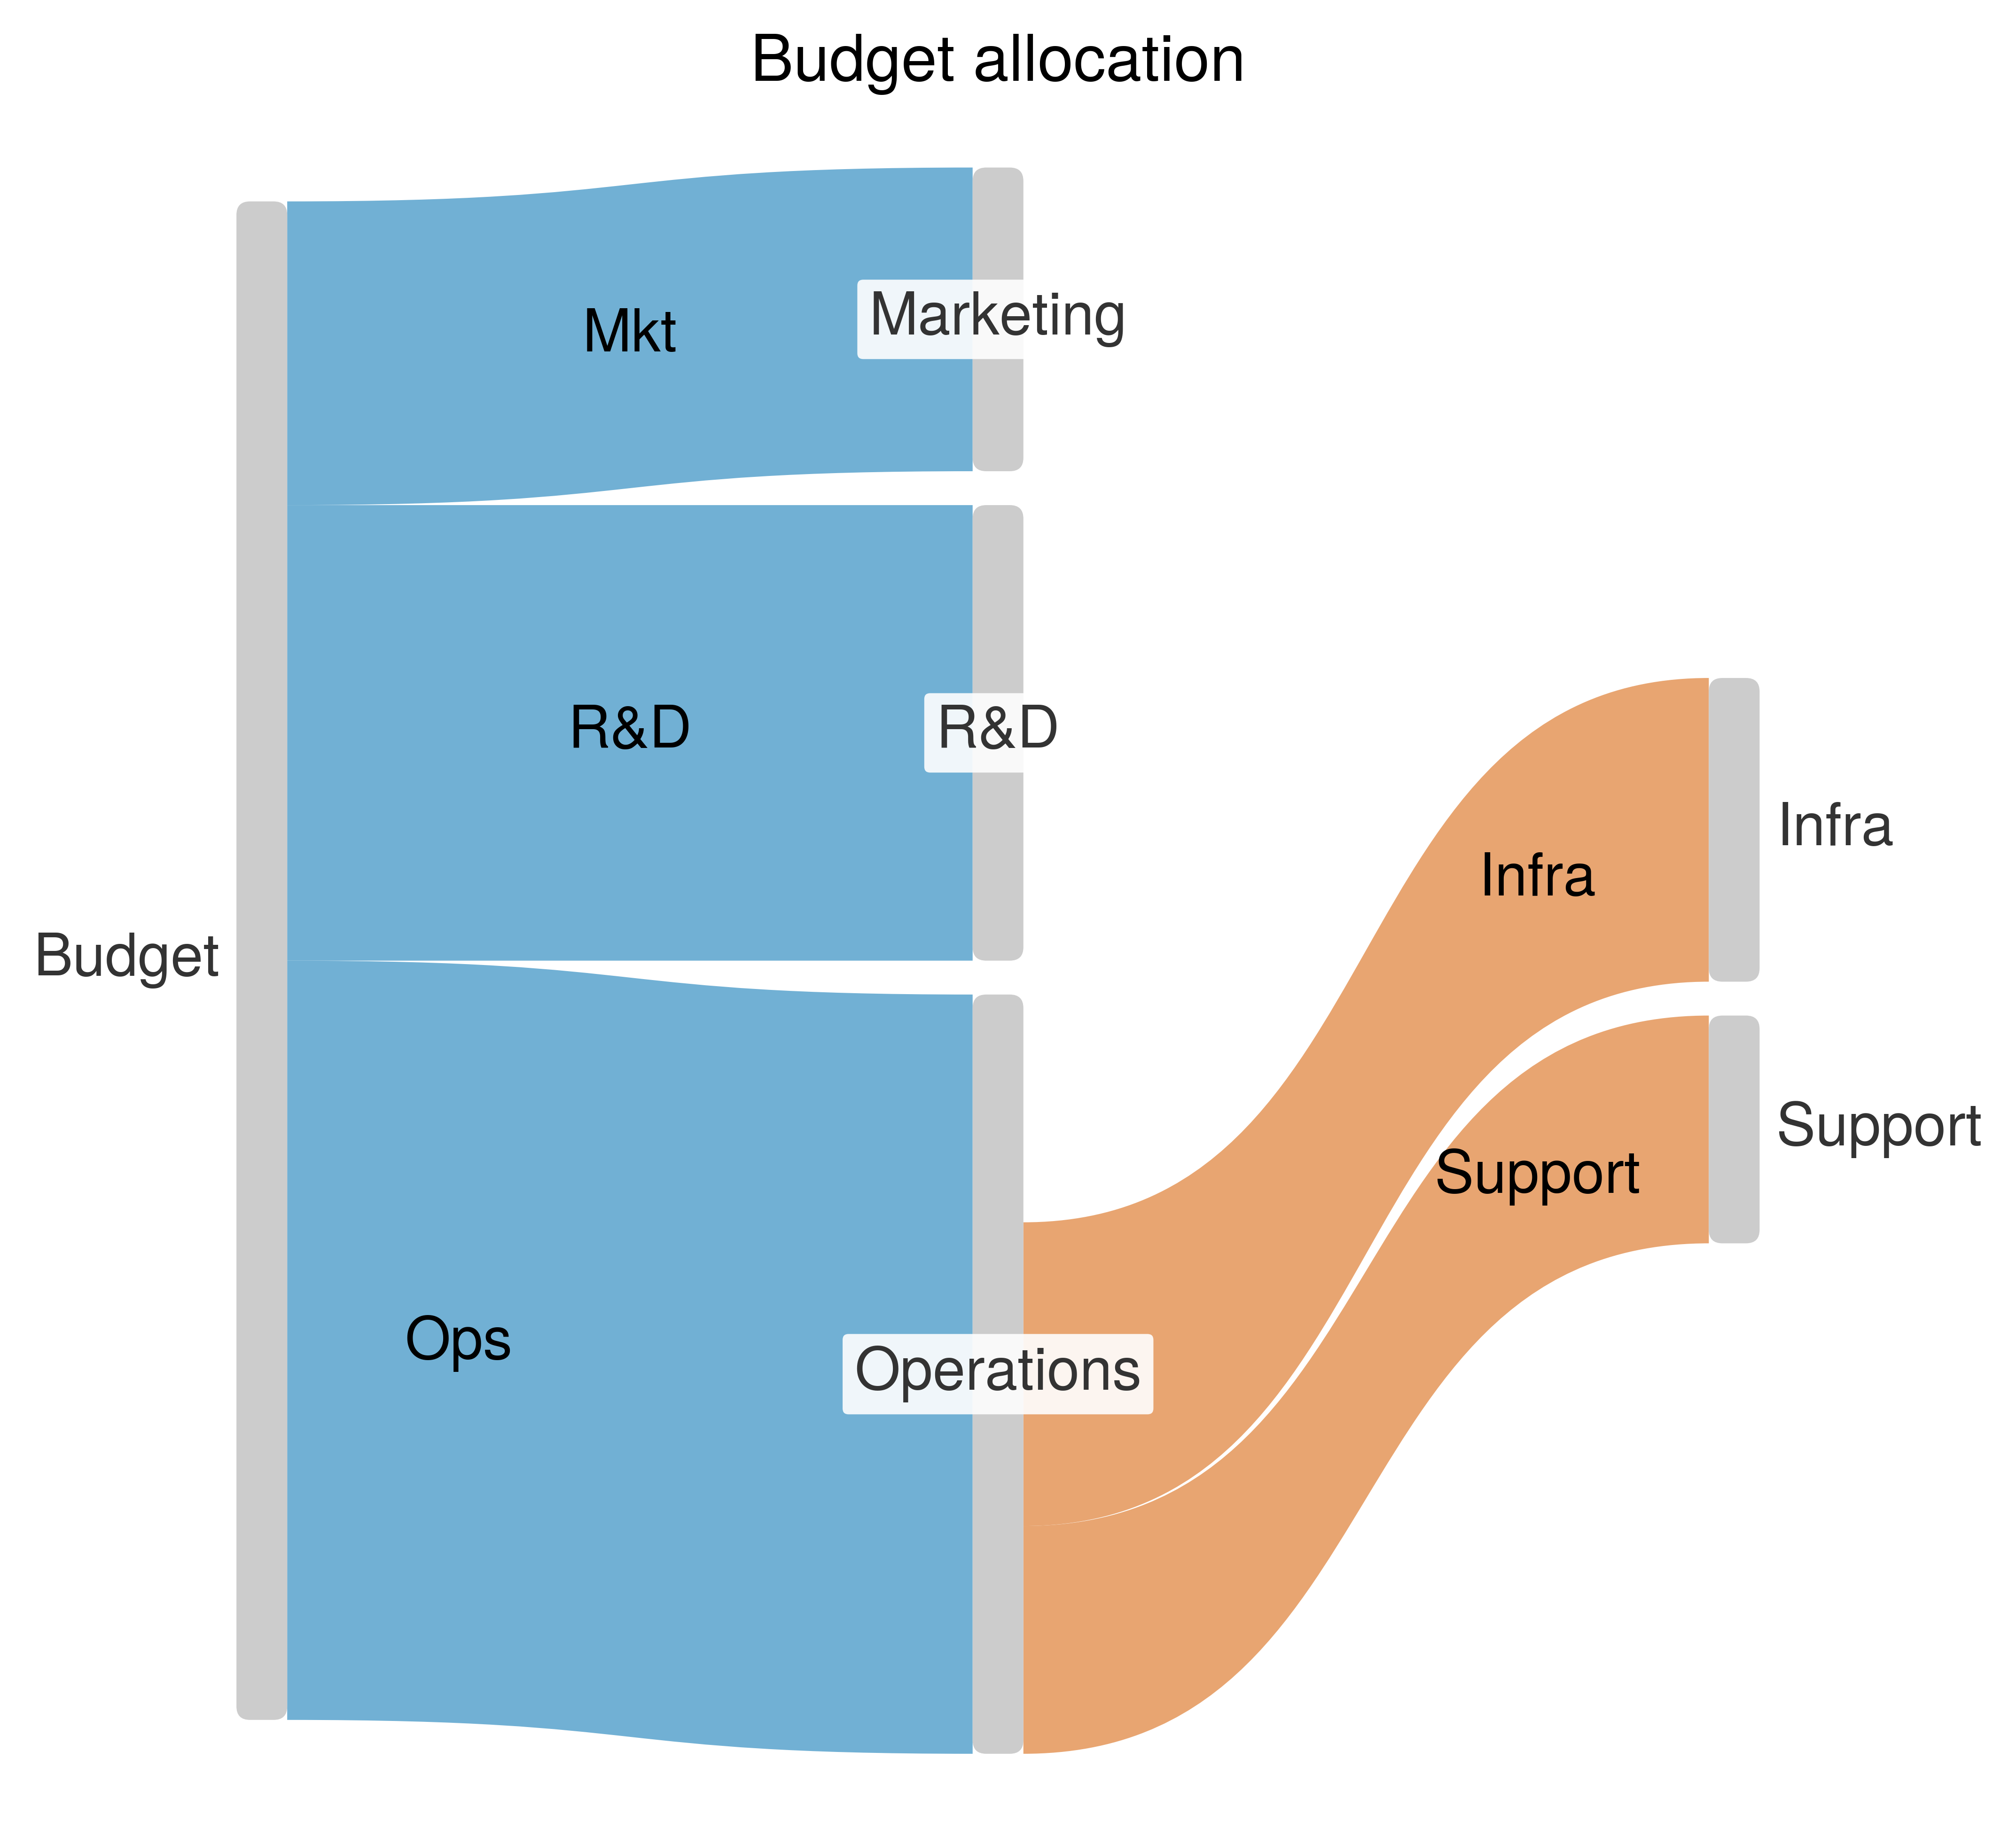
An example of UltraPlot’s layered Sankey renderer for publication-ready flow diagrams.
Why UltraPlot here?#
sankey in layered mode handles node ordering, flow styling, and
label placement without manual geometry.
Key function: ultraplot.axes.PlotAxes.sankey().
See also#
import ultraplot as uplt

nodes = ["Budget", "Operations", "R&D", "Marketing", "Support", "Infra"]
flows = [
    ("Budget", "Operations", 5.0, "Ops"),
    ("Budget", "R&D", 3.0, "R&D"),
    ("Budget", "Marketing", 2.0, "Mkt"),
    ("Operations", "Support", 1.5, "Support"),
    ("Operations", "Infra", 2.0, "Infra"),
]

fig, ax = uplt.subplots(refwidth=3.6)
ax.sankey(
    nodes=nodes,
    flows=flows,
    style="budget",
    flow_labels=True,
    value_format="{:.1f}",
    node_label_box=True,
    flow_label_pos=0.5,
)
ax.format(title="Budget allocation")
fig.show()