
Note
Go to the end to download the full example code.
Simple choropleth#
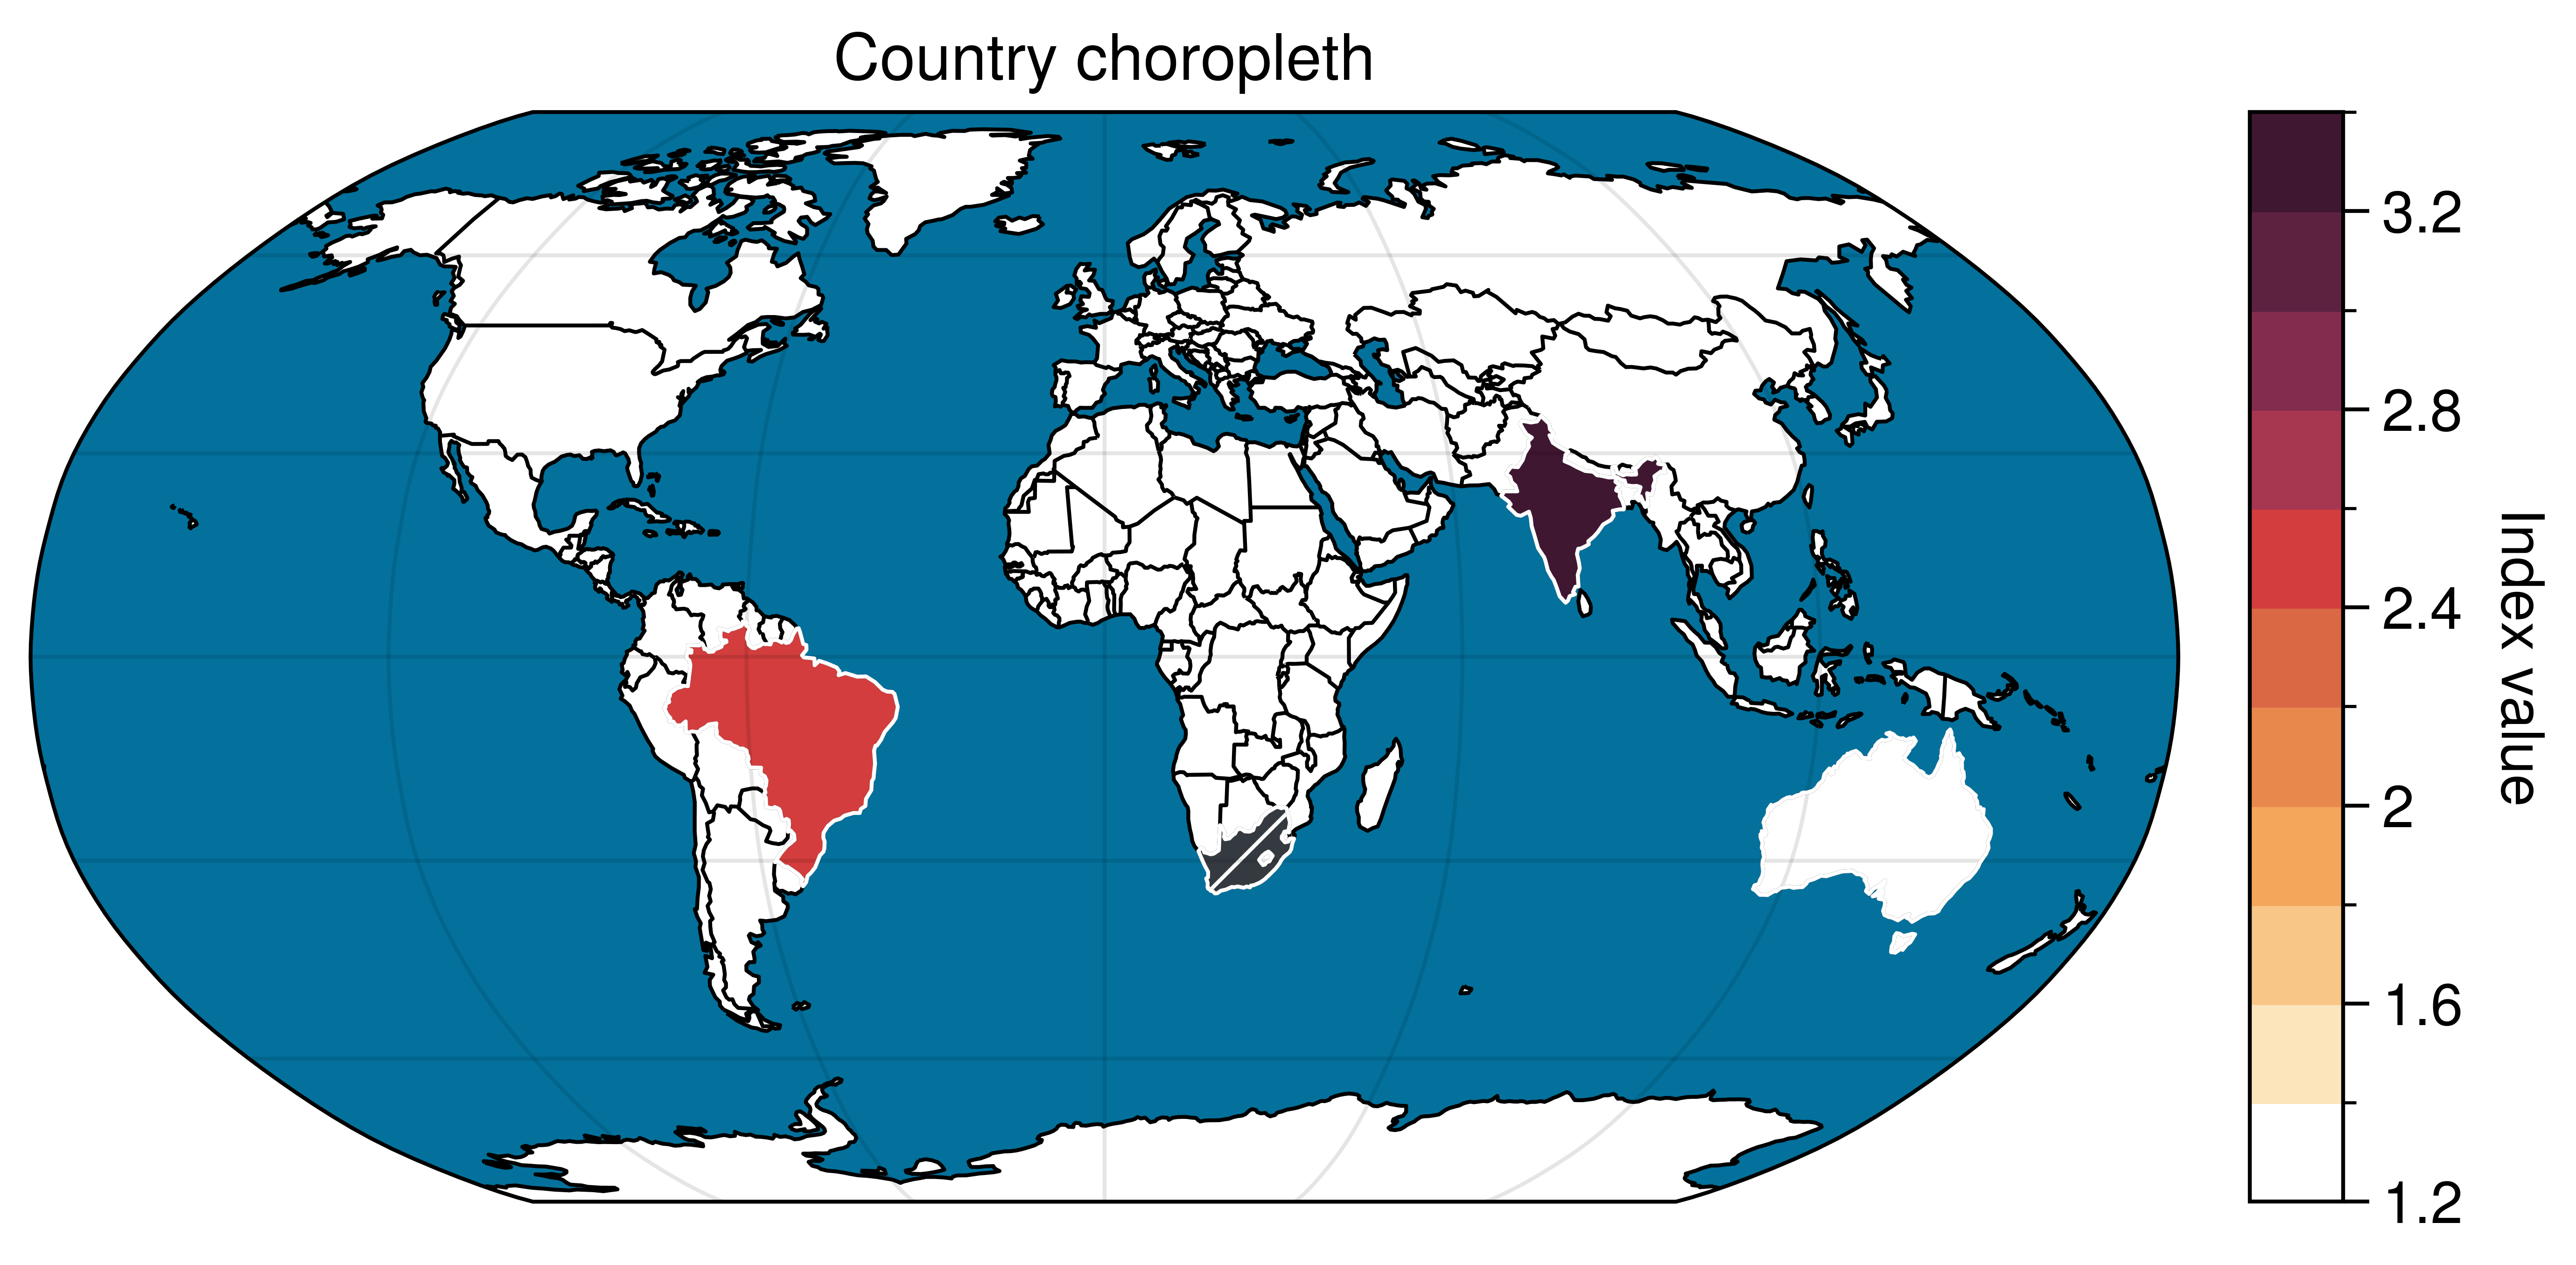
Color country-level values directly on a geographic axes.
Why UltraPlot here?#
UltraPlot now exposes choropleth(), so you can
draw country-level thematic maps from plain ISO-style identifiers while using
the same concise colorbar and formatting API used elsewhere in the library.
Key functions: ultraplot.subplots(), ultraplot.axes.GeoAxes.choropleth().
See also#
import numpy as np

import ultraplot as uplt

country_values = {
    "AUS": 1.2,
    "BRA": 2.6,
    "IND": 3.4,
    "ZAF": np.nan,
}

fig, ax = uplt.subplots(proj="robin", refwidth=4.6)

ax.choropleth(
    country_values,
    country=True,
    cmap="Fire",
    edgecolor="white",
    linewidth=0.6,
    colorbar="r",
    colorbar_kw={"label": "Index value"},
    missing_kw={"facecolor": "gray8", "hatch": "//", "edgecolor": "white"},
)

ax.format(
    title="Country choropleth",
    ocean=True,
    oceancolor="ocean blue",
    coast=True,
    borders=True,
    lonlines=60,
    latlines=30,
    labels=False,
)

fig.show()
Total running time of the script: (0 minutes 2.155 seconds)