
Font selection#
UltraPlot registers several new fonts and includes tools for adding your own fonts. These features are described below.
Included fonts#
Matplotlib provides a ~matplotlib.font_manager module for working with
system fonts and classifies fonts into five font families:
rc['font.serif'] rc['font.sans-serif'], rc['font.monospace'],
rc['font.cursive'], and rc['font.fantasy']. The default font family
is sans-serif, because sans-serif fonts are generally more suitable for
figures than serif fonts, and the default font name belonging to this family
is DejaVu Sans, which comes packaged with
matplotlib.
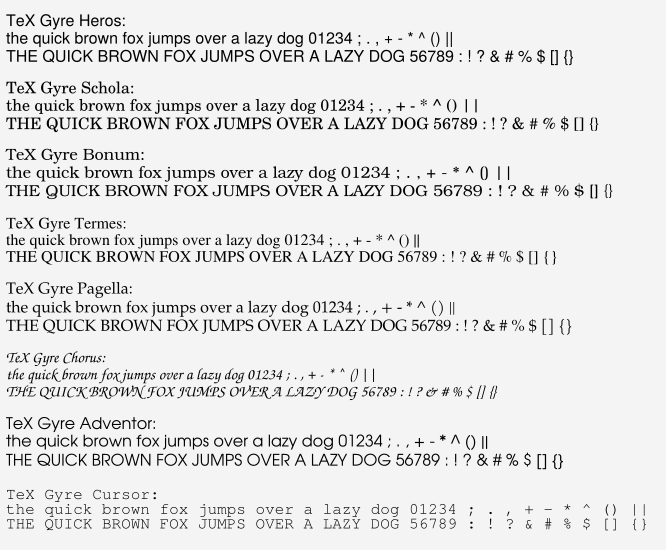
Matplotlib uses DejaVu Sans in part because it includes glyphs for a very wide range of symbols, especially mathematical symbols. However in our opinion, DejaVu Sans is not very aesthetically pleasing. To improve the font selection while keeping things consistent across different workstations, UltraPlot is packaged the open source TeX Gyre fonts and a few additional open source sans-serif fonts. UltraPlot also uses the TeX Gyre fonts as the first (i.e., default) entries for each of matplotlib’s font family lists:
The Helvetica lookalike
rc['font.sans-serif']='TeX Gyre Heros'.The Century lookalike
rc['font.serif']='TeX Gyre Schola'.The Chancery lookalike
rc['font.cursive']='TeX Gyre Chorus'.The Avant Garde lookalike
rc['font.fantasy']='TeX Gyre Adventor'.The Courier lookalike
rc['font.monospace']='TeX Gyre Cursor'.
After importing UltraPlot, the default matplotlib font will be
TeX Gyre Heros, which
emulates the more conventional and (in our opinion) aesthetically pleasing
font Helvetica. The default font
family lists are shown in the default ultraplotrc file.
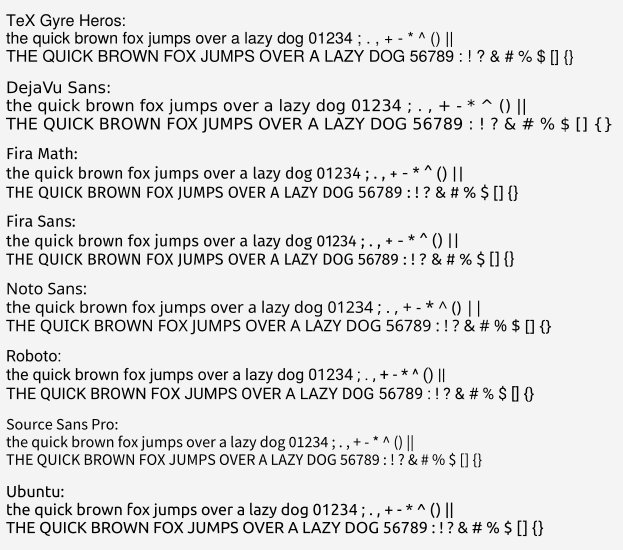
To compare different fonts, use the show_fonts() command with the
family keyword (default behavior is family='sans-serif'). Tables of the TeX
Gyre and sans-serif fonts packaged with UltraPlot are shown below.
[1]:
import ultraplot as uplt

fig, axs = uplt.show_fonts(family="sans-serif")
[2]:
import ultraplot as uplt

fig, axs = uplt.show_fonts(family="tex-gyre")
Math text fonts#
In matplotlib, math text rendered by TeX can be produced by surrounding
an expression with $dollar signs$. To help math text jive better with
the new default non-math text font, UltraPlot changes
rc['mathtext.fontset'] to 'custom'. This means that math is drawn with
the italicized version of the non-math font (see the matplotlib math text
guide
for details). This generally improves the appearance of figures with simple
math expressions. However, if you need unusual math symbols or complex math
operators, you may want to change rc['font.name'] to something more suitable
for math (e.g., the UltraPlot-packaged font 'Fira Math' or the matplotlib-packaged
font 'DejaVu Sans'; see this page for
more on Fira Math). Alternatively, you can change the math text font alone by setting
rc['mathtext.fontset'] back to one of matplotlib’s math-specialized font sets
(e.g., 'stixsans' or 'dejavusans').
In short, math fonts can be tailored to taste at three levels, depending on how much of the “LaTeX look” you want:
Match the document font (the default). With the
'custom'font set, math follows the active text font – including fonts assigned to individual text objects, as demonstrated below.Computer Modern symbols. Keep the active font for letters and numbers but render
\mathcaland big operators with authentic Computer Modern glyphs by settingrc['mathtext.cm_symbols']toTrue(see below).Full LaTeX. Set matplotlib’s
rc['text.usetex']toTrueto delegate all text rendering to an external LaTeX installation. This gives complete LaTeX typesetting but is much slower and requires TeX on your system – with the previous two options it is rarely necessary.
The example below demonstrates the first level: the same expression rendered with different fonts assigned per text object.
[3]:
import ultraplot as uplt

expr = (
    r"$\mathcal{ABCXYZ}\quad"
    r"\sum_{i=0}^{n}\quad"
    r"\prod_{j=1}^{m}\quad"
    r"\int_a^b\quad"
    r"\oint_C$"
)

fig, axs = uplt.subplots(nrows=3, refwidth=6, refheight=1.1, share=False, span=False)
for ax, font in zip(axs, ("TeX Gyre Heros", "Fira Math", "DejaVu Sans")):
    ax.text(0.02, 0.5, expr, transform="axes", va="center", fontsize=24, fontname=font)
    ax.format(title=font, titleloc="left")
axs.format(xlocator="null", ylocator="null", xspineloc="none", yspineloc="none")
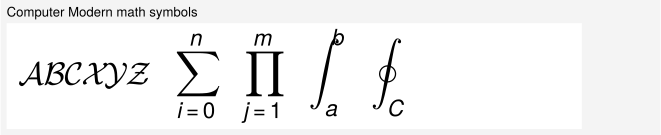
Computer Modern symbols#
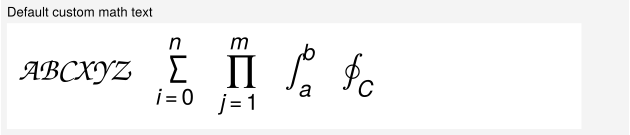
If you want to retain the active alphabet and number fonts while using
Computer Modern for selected LaTeX-style symbols, set rc['mathtext.cm_symbols']
to True. This routes \mathcal through cmsy10 and big operators like
\sum, \prod, \int, \oint, \bigcup, and \bigoplus through
cmex10. This does not affect ordinary letters and numbers, and it does not
provide a Computer Modern \mathfrak font because matplotlib’s bundled
mathtext fonts do not include one. Note that math text is parsed when the
figure is drawn, so the setting must be active at draw time – assign it
globally rather than wrapping plotting commands in a context block.
[4]:
fig, ax = uplt.subplots(refwidth=6, refheight=1.1)
ax.text(0.02, 0.5, expr, transform="axes", va="center", fontsize=24)
ax.format(
    title="Default custom math text",
    titleloc="left",
    xlocator="null",
    ylocator="null",
    xspineloc="none",
    yspineloc="none",
)
[5]:
uplt.rc["mathtext.cm_symbols"] = True
fig, ax = uplt.subplots(refwidth=6, refheight=1.1)
ax.text(0.02, 0.5, expr, transform="axes", va="center", fontsize=24)
ax.format(
    title="Computer Modern math symbols",
    titleloc="left",
    xlocator="null",
    ylocator="null",
    xspineloc="none",
    yspineloc="none",
)
[6]:
uplt.rc["mathtext.cm_symbols"] = False # restore the default
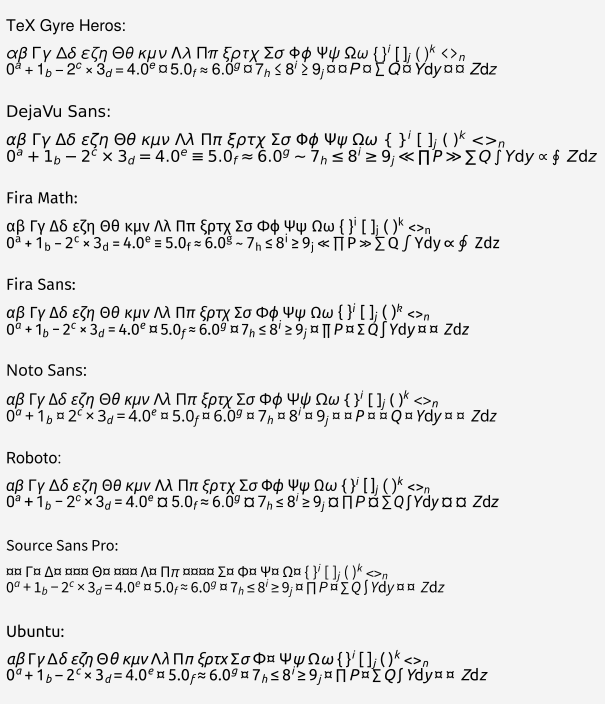
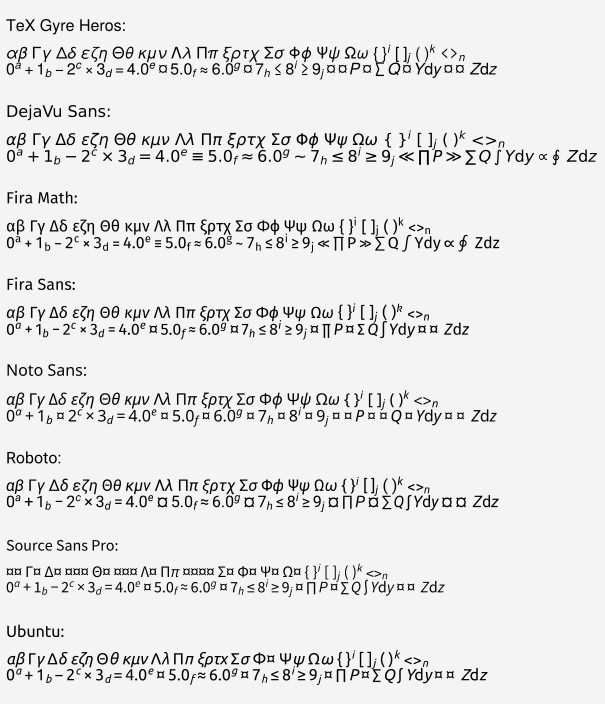
A table of math text containing the sans-serif fonts packaged with UltraPlot is shown
below. The dummy glyph “¤” is shown where a given math character is unavailable
for a particular font (in practice, the fallback font rc['mathtext.fallback'] = 'stixsans' is used
whenever a math character is unavailable, but show_fonts() disables
this fallback font in order to highlight the missing characters).
Note
UltraPlot modifies matplotlib’s math text internals so that the 'custom'
font set can be applied with modifications to the currently active non-math
font rather than only a global font family. This works by changing the default
values of rc['mathtext.bf'], rc['mathtext.it'], rc['mathtext.rm'],
rc['mathtext.sf'] from the global default font family 'sans' to the local
font family 'regular', where 'regular' is a dummy name permitted by
UltraPlot (see the ultraplotrc file for details). This means
that if rc['mathtext.fontset'] is 'custom' and the font family is changed
for an arbitrary Text instance, then any LaTeX-generated math
in the text string will also use this font family.
[7]:
import ultraplot as uplt

fig, axs = uplt.show_fonts(family="sans-serif", math=True)
Using your own fonts#
You can register your own fonts by adding files to the fonts subfolder
inside user_folder() and calling
register_fonts(). This command is called on import. You can
also manually pass file paths to register_fonts().
To change the default font, use the rc()
object or modify your ultraplotrc. See the
configuration section for details.
Sometimes the font you would like to use is installed, but the font file
is not stored under the matplotlib-compatible .ttf, .otf, or .afm
formats. For example, several macOS fonts are unavailable because they are
stored as .dfont collections. Also, while matplotlib nominally supports
.ttc collections, UltraPlot ignores them because figures with .ttc fonts
cannot be saved as PDFs.
You can get matplotlib to use .dfont and .ttc collections by
expanding them into individual .ttf files with the
DFontSplitter application,
then saving the files in-place or in the ~/.UltraPlot/fonts folder.
To find font collections, check the paths listed in OSXFontDirectories,
X11FontDirectories, MSUserFontDirectories, and MSFontDirectories
under the matplotlib.font_manager module.