
Note
Go to the end to download the full example code.
Ternary Plots#
Ternary plots are a type of plot that displays the proportions of three variables that sum to a constant. They are commonly used in fields such as geology, chemistry, and materials science to represent the composition of mixtures. UltraPlot makes it easy to create publication-quality ternary plots using the mpltern library as a backend.
Why UltraPlot here?#
UltraPlot offers seamless integration with mpltern, allowing users to create and customize ternary plots with minimal effort. UltraPlot’s high-level API simplifies the process of setting up ternary plots, adding data, and formatting the axes and labels.
See also#
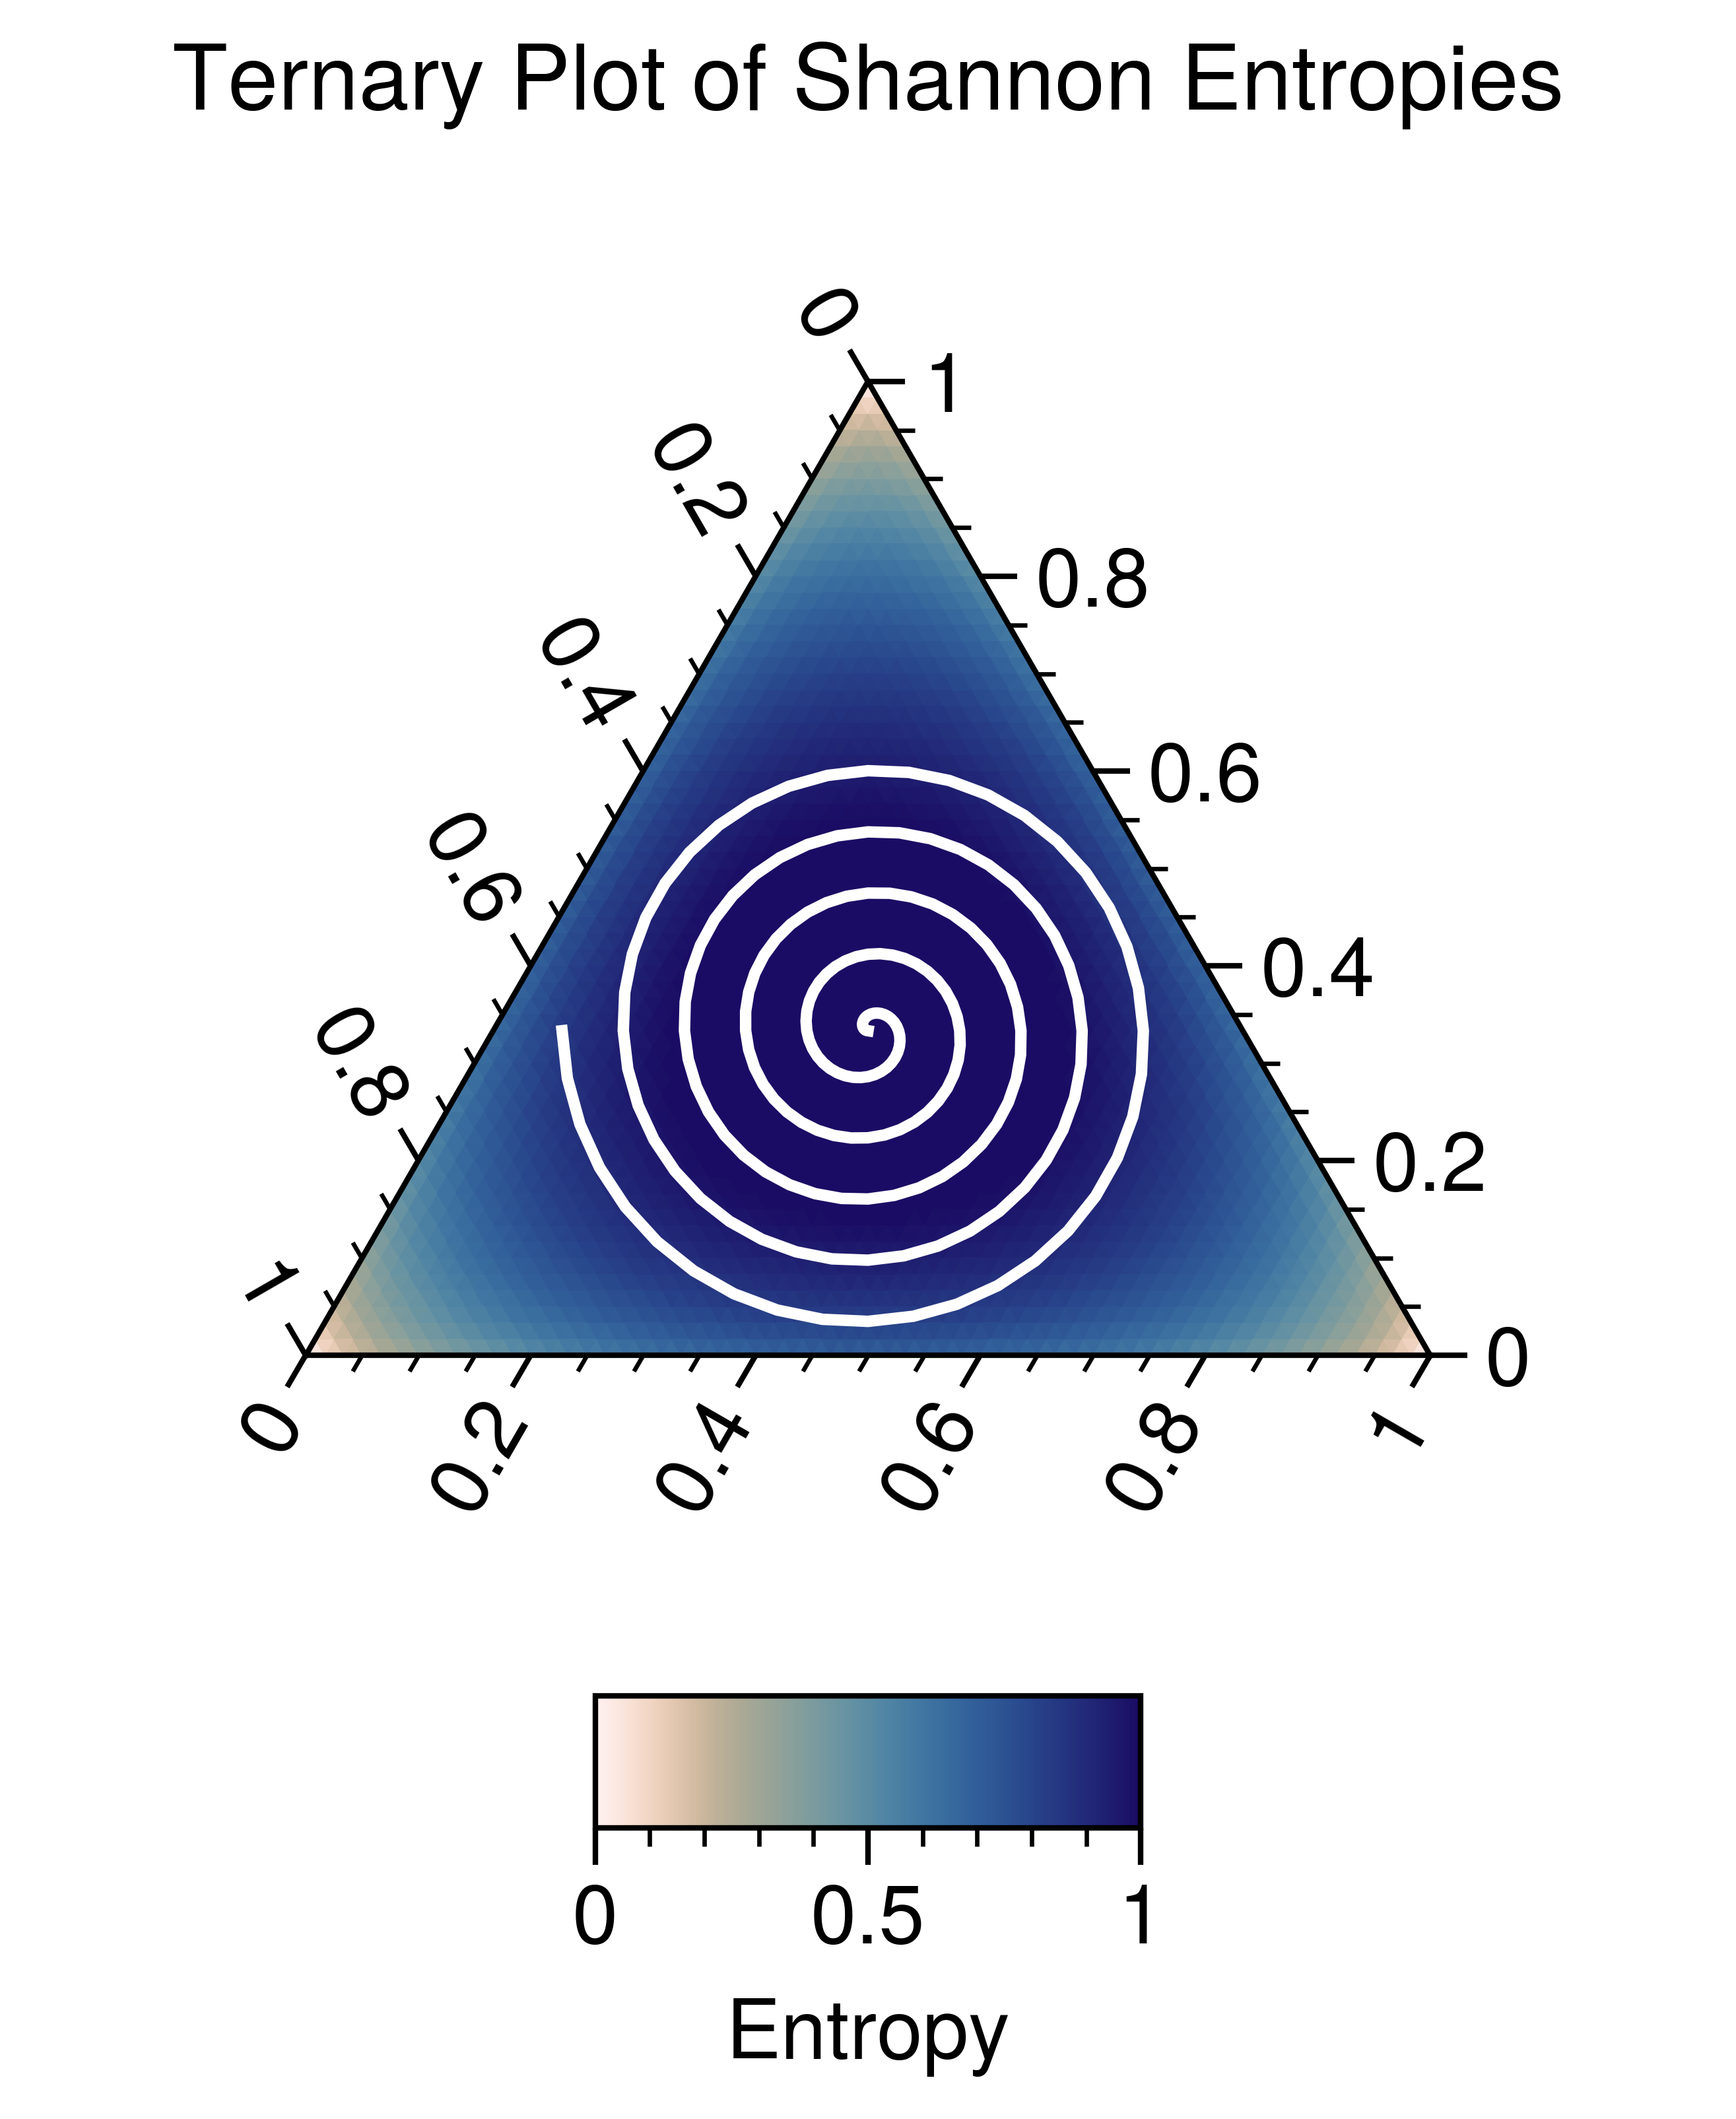
import mpltern


from mpltern.datasets import get_shanon_entropies, get_spiral
import ultraplot as uplt, numpy as np

t, l, r, v = get_shanon_entropies()

fig, ax = uplt.subplots(projection="ternary")
vmin = 0.0
vmax = 1.0
levels = np.linspace(vmin, vmax, 7)

cs = ax.tripcolor(t, l, r, v, cmap="lapaz_r", shading="flat", vmin=vmin, vmax=vmax)
ax.set_title("Ternary Plot of Shannon Entropies")
ax.plot(*get_spiral(), color="white", lw=1.25)
colorbar = ax.colorbar(
    cs,
    loc="b",
    align="c",
    title="Entropy",
    length=0.33,
)

fig.show()
Total running time of the script: (0 minutes 1.839 seconds)