
Note
Go to the end to download the full example code.
Top-aligned ribbon flow#
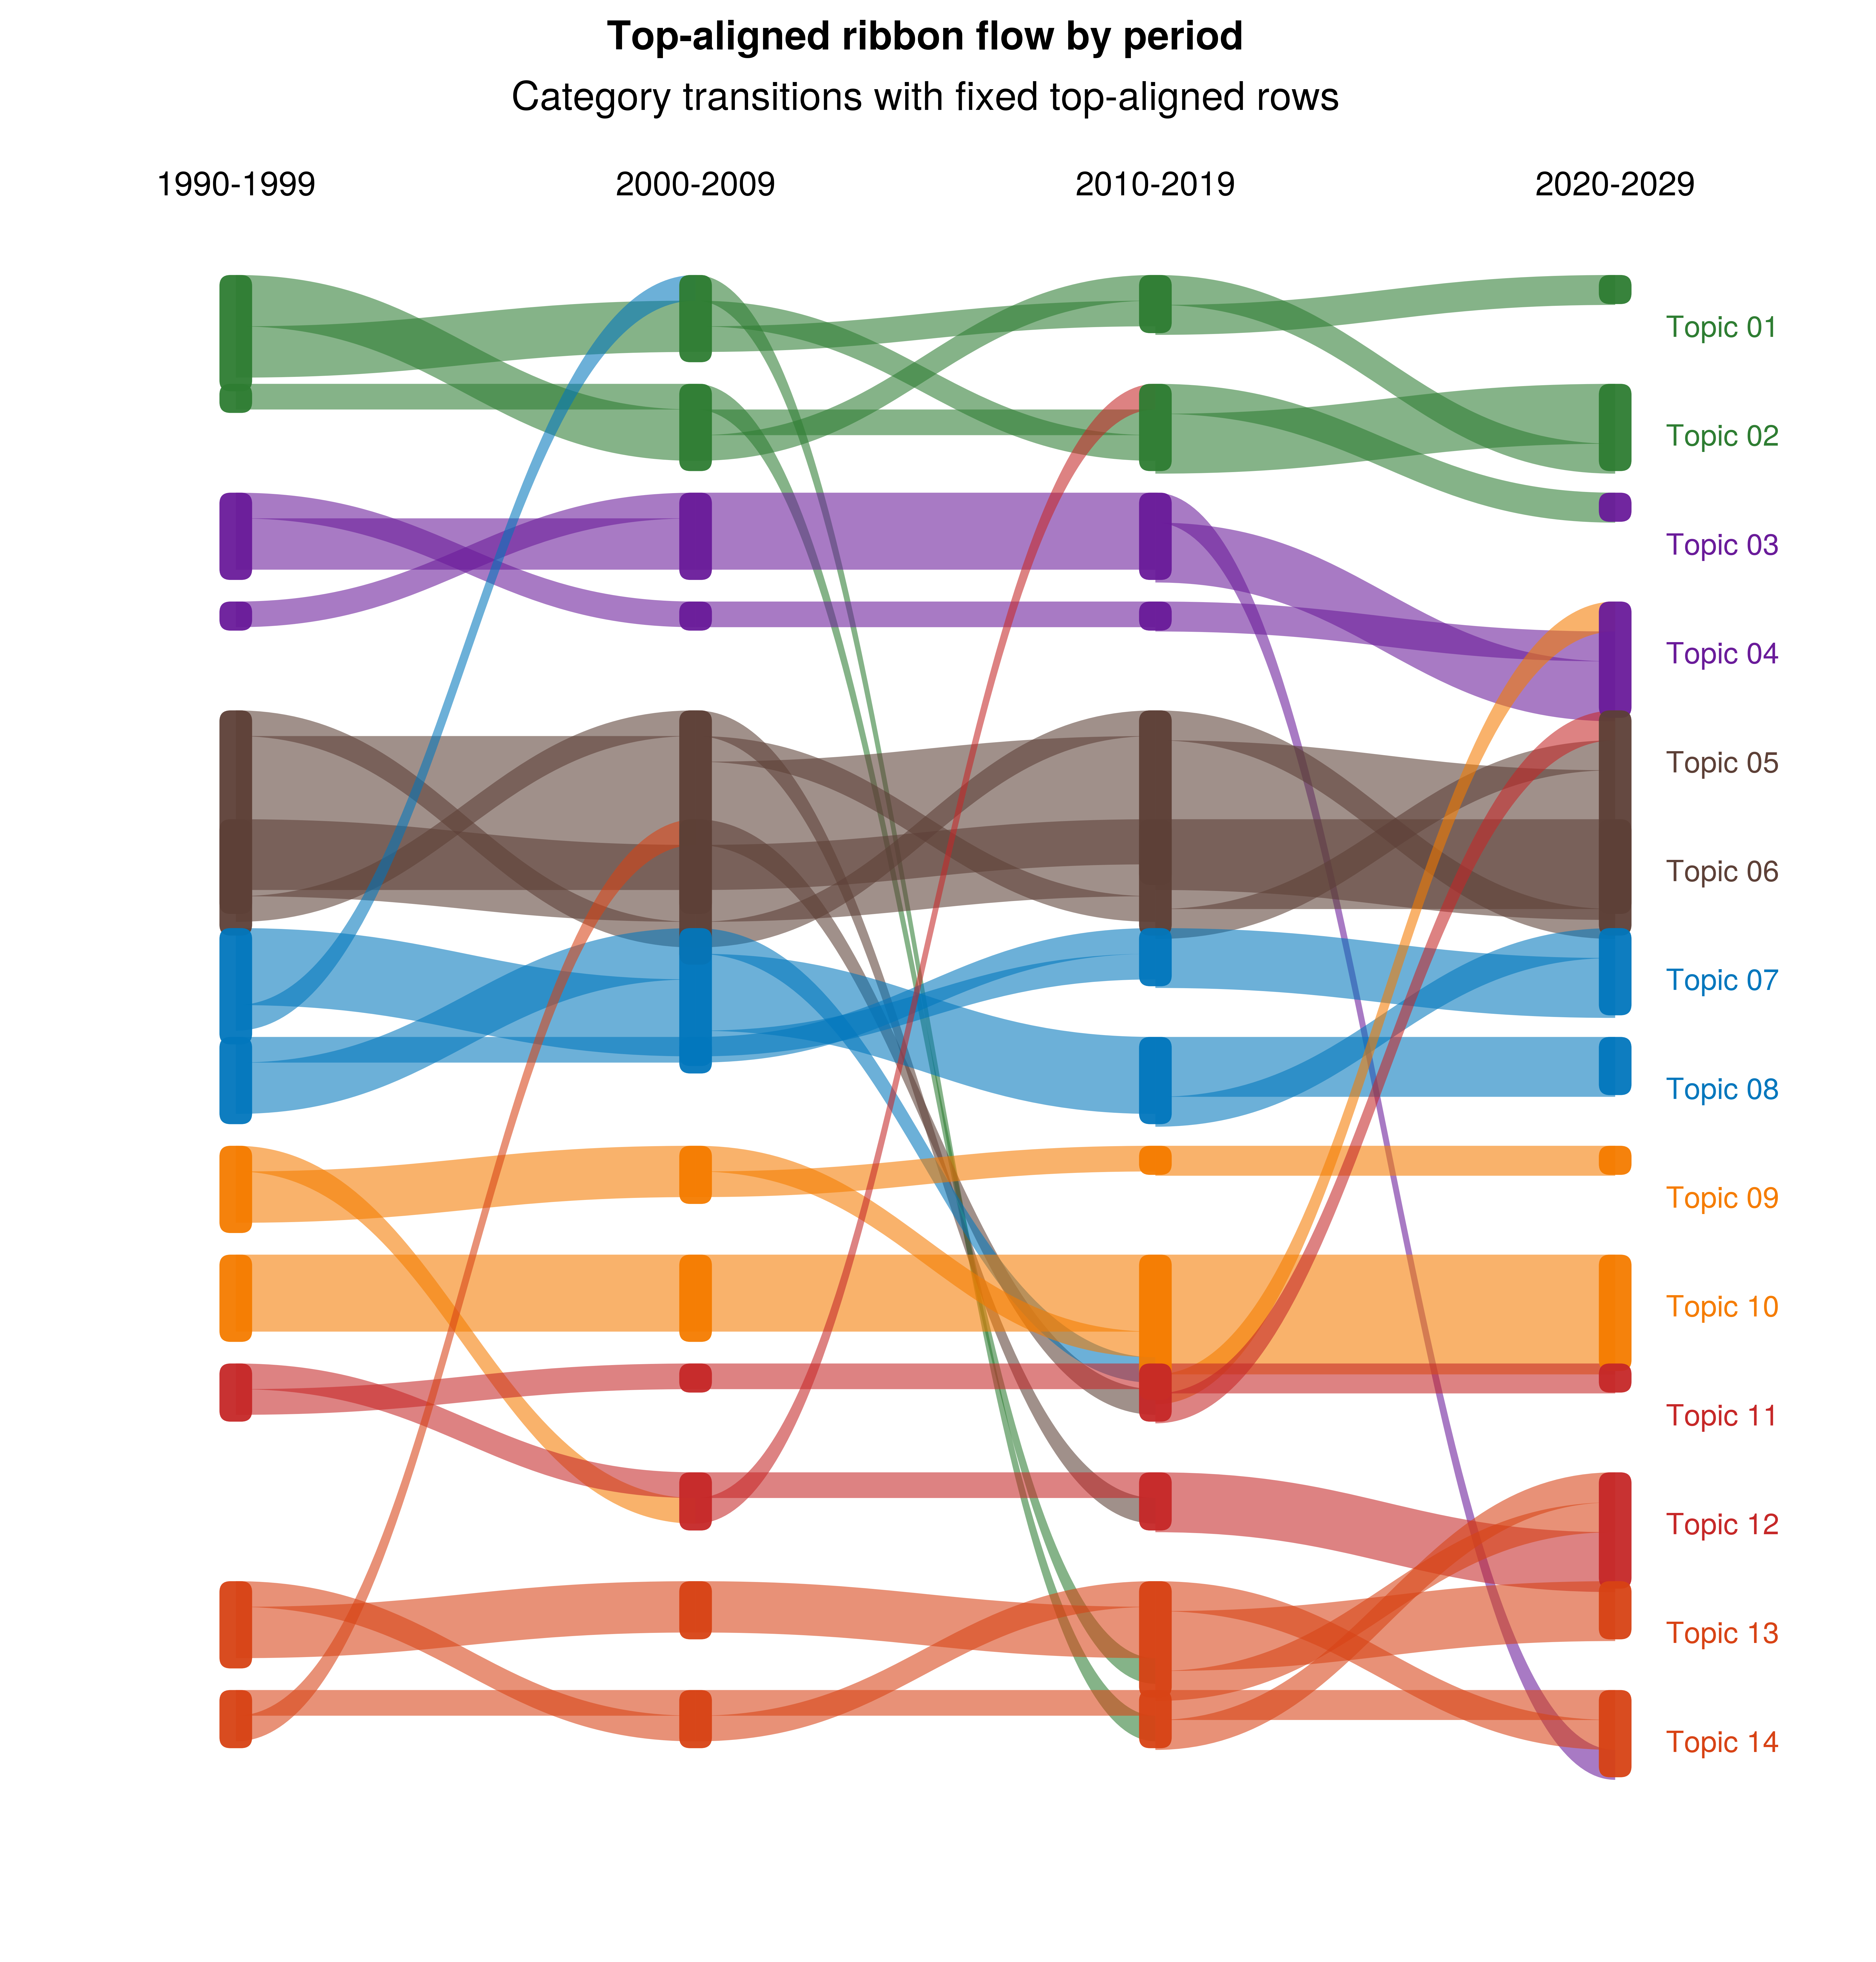
Fixed-row ribbon flows for category transitions across adjacent periods.
Why UltraPlot here?#
This is a distinct flow layout from Sankey: topic rows are fixed globally and flows are stacked from each row top, so vertical position is semantically stable.
Key function: ultraplot.axes.PlotAxes.ribbon().
See also#
import numpy as np
import pandas as pd

import ultraplot as uplt

GROUP_COLORS = {
    "Group A": "#2E7D32",
    "Group B": "#6A1B9A",
    "Group C": "#5D4037",
    "Group D": "#0277BD",
    "Group E": "#F57C00",
    "Group F": "#C62828",
    "Group G": "#D84315",
}

TOPIC_TO_GROUP = {
    "Topic 01": "Group A",
    "Topic 02": "Group A",
    "Topic 03": "Group B",
    "Topic 04": "Group B",
    "Topic 05": "Group C",
    "Topic 06": "Group C",
    "Topic 07": "Group D",
    "Topic 08": "Group D",
    "Topic 09": "Group E",
    "Topic 10": "Group E",
    "Topic 11": "Group F",
    "Topic 12": "Group F",
    "Topic 13": "Group G",
    "Topic 14": "Group G",
}


def build_assignments():
    """Synthetic entity-category assignments by period."""
    state = np.random.RandomState(51423)
    countries = [f"Entity {i:02d}" for i in range(1, 41)]
    periods = ["1990-1999", "2000-2009", "2010-2019", "2020-2029"]
    topics = list(TOPIC_TO_GROUP.keys())

    rows = []
    for country in countries:
        topic = state.choice(topics)
        rows.append((country, periods[0], topic))
        for period in periods[1:]:
            if state.rand() < 0.68:
                next_topic = topic
            else:
                group = TOPIC_TO_GROUP[topic]
                same_group = [
                    t for t in topics if TOPIC_TO_GROUP[t] == group and t != topic
                ]
                next_topic = state.choice(
                    same_group if same_group and state.rand() < 0.6 else topics
                )
            topic = next_topic
            rows.append((country, period, topic))
    return pd.DataFrame(rows, columns=["country", "period", "topic"]), periods


df, periods = build_assignments()

group_order = list(GROUP_COLORS)
topic_order = []
for group in group_order:
    topic_order.extend(sorted([t for t, g in TOPIC_TO_GROUP.items() if g == group]))

fig, ax = uplt.subplots(refwidth=6.3)
ax.ribbon(
    df,
    id_col="country",
    period_col="period",
    topic_col="topic",
    period_order=periods,
    topic_order=topic_order,
    group_map=TOPIC_TO_GROUP,
    group_order=group_order,
    group_colors=GROUP_COLORS,
)

ax.format(title="Category transitions with fixed top-aligned rows")
fig.format(suptitle="Top-aligned ribbon flow by period")
fig.show()
Total running time of the script: (0 minutes 1.518 seconds)