
Data-aware plotting#
UltraPlot recognizes labelled data from pandas and xarray. Pass a pandas Series or DataFrame directly to an axes method and UltraPlot can use its index, column names, and axis metadata to choose coordinates and labels. This keeps the plotting call focused on the data instead of repeating its description in several formatting arguments.
The example below starts with a small, labelled DataFrame. The date index becomes the horizontal coordinate, and the column names become legend labels.
[1]:
import numpy as np
import pandas as pd
import ultraplot as uplt

dates = pd.date_range("2025-01-01", periods=24, freq="MS")
season = np.sin(np.linspace(0, 2 * np.pi, dates.size))
data = pd.DataFrame(
    {
        "observed": 18 + 3 * season,
        "smoothed": 18 + 2.5 * season,
    },
    index=dates,
)
data.index.name = "Date"

fig, ax = uplt.subplots()
ax.plot(data)
ax.format(title="Monthly temperature", ylabel="Temperature (°C)")
ax.legend(loc="ur", ncols=1)
[1]:
<ultraplot.legend.Legend at 0x719c1797c440>
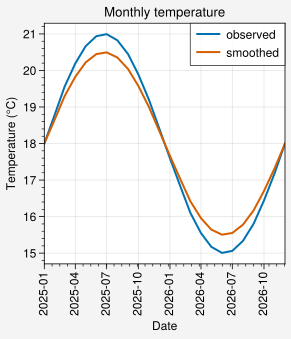
What UltraPlot inferred#
The DataFrame index supplies the x coordinates, while its column labels are
available to the legend. You can still override any inferred value with the
usual plotting or format() keyword arguments.
For data arrays, coordinate inference works the same way with xarray. See the detailed 1D integration guide and 2D integration guide for MultiIndex data, DataArrays, and labelled two-dimensional plots.